
Chapter 1. Chapter 1: Process of Science
1.1 Introduction

Welcome to the Interactive Study Guide for Chapter 1: Process of Science! This Study Guide will help you master your understanding of the chapter's Driving Questions, using interactive Infographics and activities, as well as targeted assessment questions. Click "Next" to get started, or select a Driving Question from the drop-down menu to the right.
Java Report:
Making sense of the latest buzz in health-related news
DRIVING QUESTIONS
- How is the scientific method used to test hypotheses?
- What factors influence the strength of scientific studies and whether the results of any given study are applicable to a particular population?
- How can you evaluate the evidence in media reports of scientific studies?
- How does the scientific method apply in clinical trials designed to investigate important issues in human health?
1.2 Driving Question 1
Driving Question 1
How is the scientific method used to test hypotheses?
Why should you care?
When we understand how science works and how scientific evidence is obtained, interpreted and refined, we can analytically and critically evaluate the findings we read about in the media. Then we can make good, evidence-based decisions about our lifestyle choices rather than following the latest fads.
What should you know?
To fully answer this Driving Question, you should be able to:
- Describe and discuss the process of science from initial observations to publishable results.
- Compare and contrast the conclusions generated by rigorous scientific study and those generated anecdotally.
Test Your Vocabulary
Choose the correct term for each of the following definitions:
| Term | Definition |
|---|---|
| An informal observation that has not been systematically tested. | |
| A tentative explanation for a scientific observation or question. | |
| A carefully designed test, the results of which will either support or rule out a hypothesis. | |
| A process in which independent scientists read and critique scientific studies before they are published to ensure that the authors have appropriately designed and interpreted the study. | |
| The process of using observations and experiments to draw conclusions based on evidence. | |
| (A hypothesis) demonstrably ruled out by data showing that the hypothesis does not explain the observation. | |
| Subject to support or rejection (of a hypothesis) according to carefully designed experiments or observational studies. |
Describe and discuss the process of science from initial observations to publishable results.
1.
Describe the steps in the process of science.
Compare and contrast the conclusions generated by rigorous scientific study and those generated anecdotally.
3.
What is anecdotal evidence?
Review Questions
5.
What is typically the order of the scientific process?
| A. |
| B. |
| C. |
| D. |
1.3 Driving Question 2
Driving Question 2
What factors influence the strength of scientific studies and whether the results of any given study are applicable to a particular population?
Why should you care?
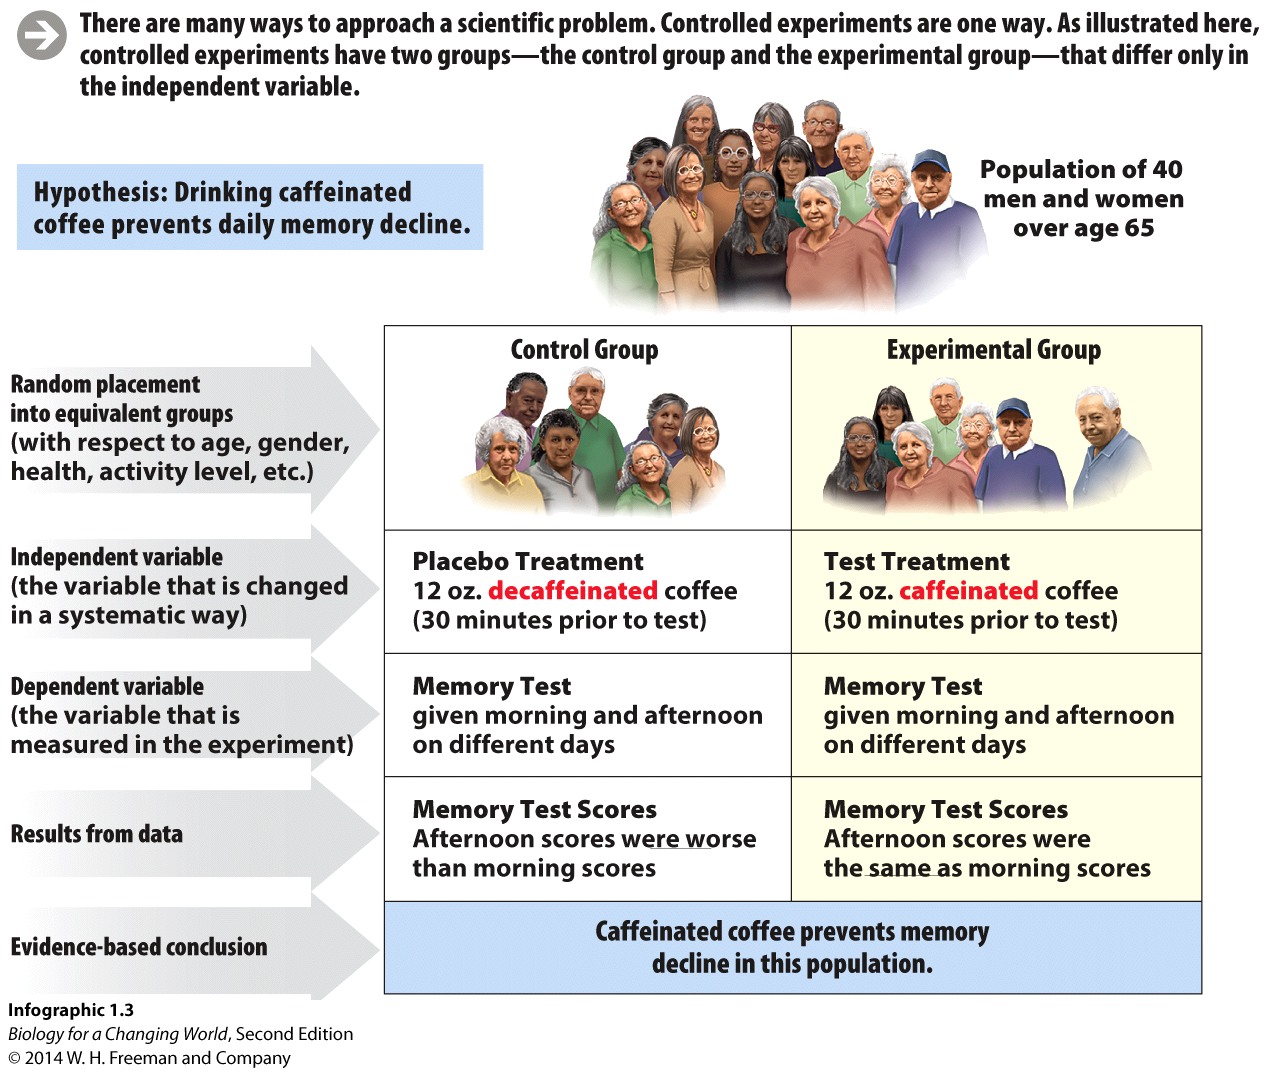
The strength of a scientific study’s conclusions depends on the quality of the study’s design. Controlled experiments are one of the most powerful tools scientists use to test hypotheses. Understanding the characteristics of a good controlled experiment helps us evaluate the conclusions we read about in media reports. Sample size is also a critical component of good research design. Typically, conclusions from studies with small sample sizes are only weakly supported. When you read media reports, one of the first things you should look for is sample size; if it is small or if it is not reported, you should remain skeptical about the reported conclusions.
What should you know?
To fully answer this Driving Question, you should be able to:
- Compare and contrast the control and experimental groups of a controlled experiment.
- Describe the design of a controlled experiment.
- Illustrate and discuss the significance of sample size on the strength of conclusions drawn from scientific studies.
Infographic Focus
The infographics most pertinent to the Driving Question are 1.3, 1.4, and 1.7.
Test Your Vocabulary
Choose the correct term for each of the following definitions:
| Term | Definition |
|---|---|
| A fake treatment given to control groups to mimic the experience of the experimental groups. | |
| The measured result of an experiment analyzed in both the experimental and control groups. | |
| The group in an experiment that undergoes the experimental intervention or manipulation. | |
| The group in an experiment that undergoes no experimental intervention or manipulation. | |
| The variable, or factor, being deliberately changed in the experimental group. | |
| A measure of confidence that the results obtained are “real” and not due to chance. | |
| The number of experimental subjects or the number of times an experiment is repeated. In human studies, sample size is the number of participants. |
Compare and contrast the control and experimental groups of a controlled experiment.
9.
Lee Ryan began her coffee-drinking study with a sample population of 40 men and women over age 65, divided into two groups.
List the similarities and differences between the control and experimental groups.
- Adults all over 65 years old
- Groups equally composed based on gender, health, and activity level
- Both given 12 ounces of beverage to drink 30 minutes prior to memory test
- Both given memory tests in the mornings and afternoons of different days
Differences:
- Control group given placebo (decaffeinated coffee)
- Experimental group given treatment (caffeinated coffee)
- Afternoon memory test scores the same as morning test scores in the Experimental group
- Afternoon memory test scores worse than morning test scores in the Control group
Describe the design of a controlled experiment.
12.
Describe the experimental design of Dr. Ryan’s coffee drinking study by answering the following questions.
What was the independent variable?
Illustrate and discuss the significance of sample size on the strength of conclusions drawn from scientific studies.
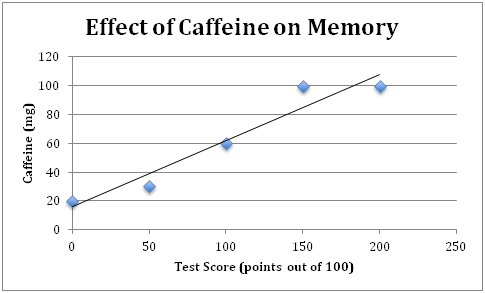
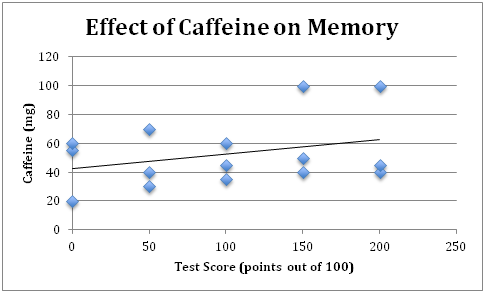
20.
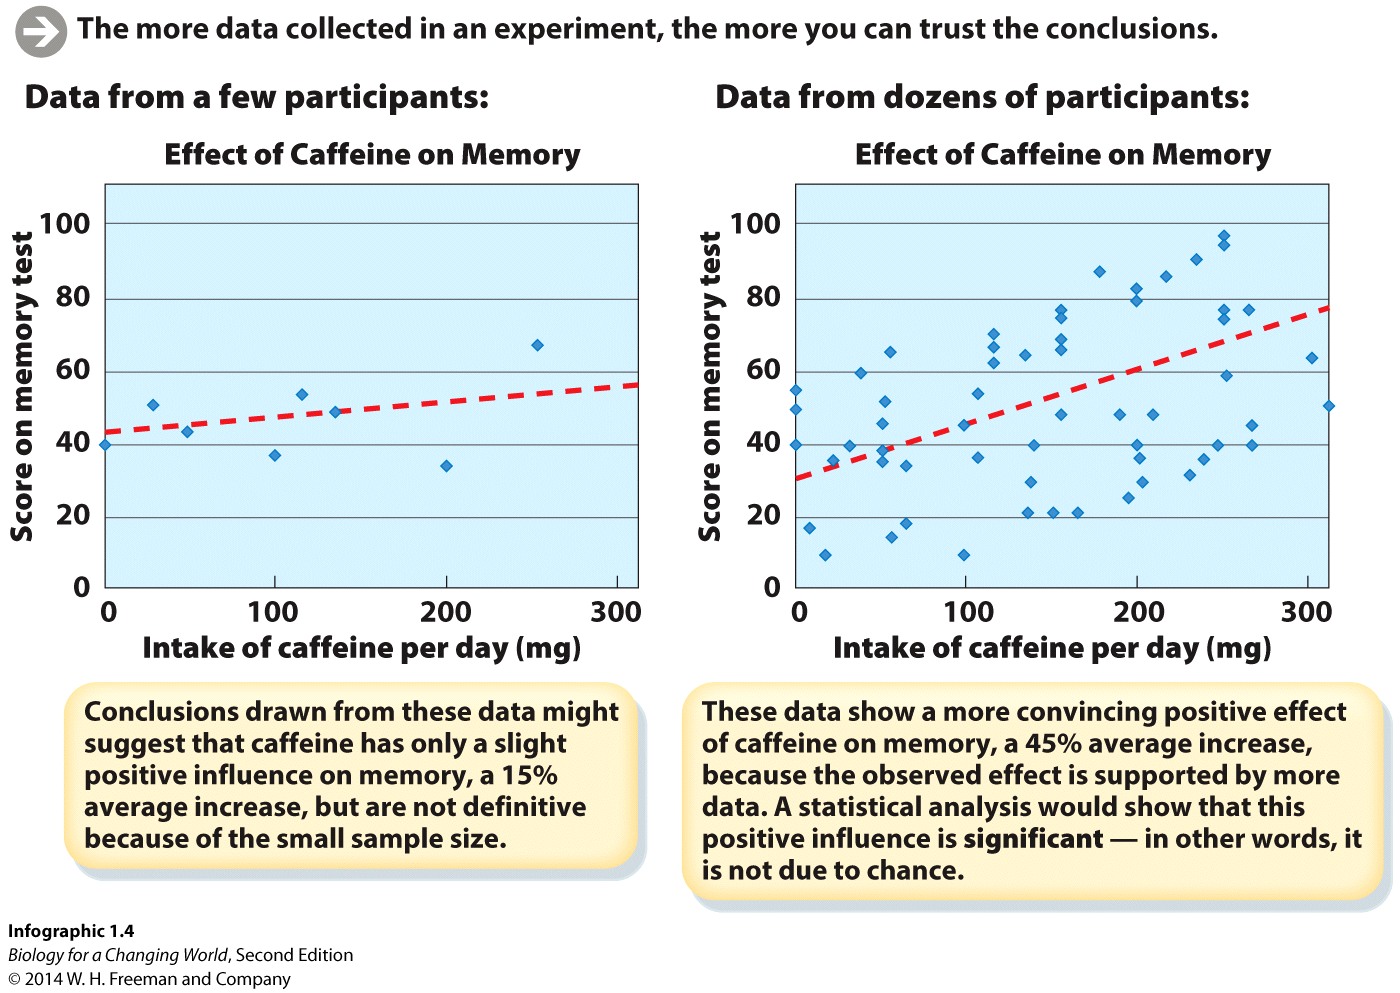
Examine the two graphs from Infographic 1.4. For each, write a one-sentence statement of what the graph shows about the relationship between milligrams of caffeine per day and score on the memory test.
Review Questions
26.
Use this scenario to answer questions 26 to 28:
You wish to test the effects of energy drinks on short-term memory in college students. You recruit 100 volunteers for your study. The control group will receive a placebo and the experimental group the same volume of Red Bull. You will administer a test of short-term memory 30 minutes after participants consume their drinks.
Which of the following best describes how you would assign participants to your experimental and control groups?
| A. |
| B. |
| C. |
| D. |
| E. |
1.4 Driving Question 3
Driving Question 3
How can you evaluate the evidence in media reports of scientific studies?
Why should you care?
Most of us are not health care professionals. Lacking the knowledge and skills to read, understand, and synthesize all of the scientific literature about human health, we must rely instead on media reports to stay informed of the latest findings and trends. We cannot, however, take those reports at face value. We need a proper understanding of the process of science to critically evaluate what we read and to use what we read to make good decisions about our own lifestyle choices. Understanding how and why important details may be missing from media reports is the final piece to helping you become a critical and analytical consumer of scientific news.
What should you know?
To fully answer this Driving Question, you should be able to:
- Compare and contrast the everyday and scientific meanings of the word “theory.”
- Explain why a correlation in a scientific study does not necessarily indicate a cause-and-effect relationship.
- Explain why media headlines may not accurately convey the results of scientific studies.
- List and describe the questions a skeptical consumer should ask about a media report before accepting the reported conclusions at face value.
Infographic Focus
The infographics most pertinent to the Driving Question are 1.2, 1.3, 1.4, 1.5, 1.7, and 1.8.
Test Your Vocabulary
Choose the correct term for each of the following definitions:
| Term | Definition |
|---|---|
| A controlled medical experiment in which subjects are randomly chosen to receive either an experimental treatment or a standard treatment (or placebo). | |
| An explanation of the natural world that is supported by a large body of evidence and has never been disproved. | |
| A consistent relationship between two variables. |
Compare and contrast the everyday and scientific meanings of the word “theory.”
30.
List the way(s) in which the two meanings of the word “theory” are similar.
Explain why a correlation in a scientific study does not necessarily indicate a cause-and-effect relationship.
32.
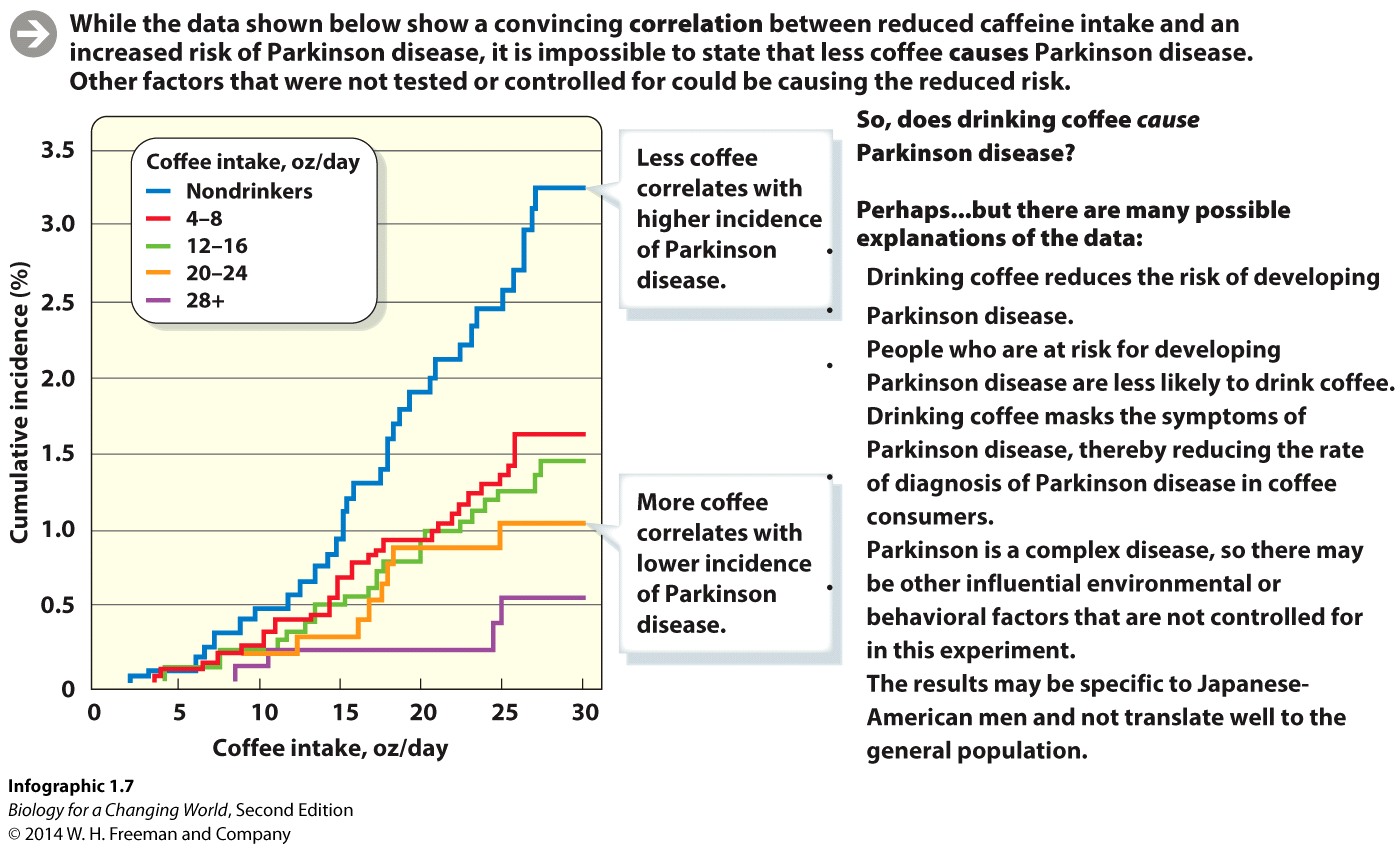
Based on the epidemiological study mentioned in the textbook, does caffeine cause a reduction in the risk of developing Parkinson disease? If not, how do you explain the pattern shown on the graph in Infographic 1.7?
Explain why media headlines may not accurately convey the results of scientific studies.
34.
List the limitations of media reports that may prevent reporters from including all relevant details of a scientific study.
List and describe the questions a skeptical consumer should ask about a media report before accepting its conclusions.
35.
List and describe the questions a skeptical consumer should ask about a media report before accepting its conclusions.
Did it have proper controls?
What was the experimental group? What was the control group?
Were all variables taken into consideration?
How were the experiments performed?
How were the data analyzed?
What do the data suggest?
Look for yourself; do not depend on someone else’s interpretation of the data, unless that person is a trusted scientific source.
When in doubt, talk about the study to someone who is familiar with the discipline or area of research.
Go straight to the source!
READ THE ORIGINAL RESEARCH PAPER the article is based on.
Review Questions
36.
“I feel more cheerful when I wear bright clothing therefore bright clothing makes people more cheerful” is an example of a(n): (mark "true" for all correct answers)
a. scientific theory
b. everyday theory
c. hypothesis
d. data
1.5 Driving Question 4
Driving Question 4
How does the scientific method apply in clinical trials designed to investigate important issues in human health?
Why should you care?
When you understand the elements of good scientific studies and some of the cautions that you must exercise when interpreting their results, you are better prepared to take information transmitted through popular media and decide, as an educated consumer, how it affects you.
What should you know?
To fully answer this Driving Question, you should be able to:
- Use all of the information learned in this chapter to assess the claims and evidence reported in clinical trials.
Infographic Focus
All of the infographics are pertinent to the Driving Question.
Test Your Vocabulary
Choose the correct term for each of the following definitions:
| Term | Definition |
|---|---|
| Subject to support or rejection (of a hypothesis) according to carefully designed experiments or observational studies. | |
| An informal observation that has not been systematically tested. | |
| A tentative explanation for a scientific observation or question. | |
| The measured result of an experiment analyzed in both the experimental and control groups. | |
| The group in an experiment that undergoes the experimental intervention or manipulation. | |
| A fake treatment given to control groups to mimic the experience of the experimental groups. | |
| A measure of confidence that the results obtained are “real” and not due to chance. | |
| A consistent relationship between two variables. | |
| The study of patterns of disease in populations, including risk factors. | |
| The number of experimental subjects or the number of times an experiment is repeated In human studies, sample size is the number of participants. | |
| A process in which independent scientists read scientific studies before they are published to ensure that the authors have appropriately designed and interpreted the study. | |
| carefully designed test, the results of which will either support or rule out a hypothesis. | |
| A controlled medical experiment in which subjects are randomly chosen to receive either an experimental treatment or a standard treatment (or placebo). | |
| explanation of the natural world that is supported by a large body of evidence and has never been disproved. | |
| The group in an experiment that undergoes no experimental intervention or manipulation. | |
| (A hypothesis) demonstrably ruled out by data showing that the hypothesis does not explain the observation. | |
| The variable, or factor, being deliberately changed in the experimental group. | |
| The process of using observations and experiments to draw conclusions based on evidence. |
Activity results are being submitted...