Chapter 1. Chapter 21: Population Ecology
1.1 Introduction
Welcome to the Interactive Study Guide for Chapter 21: Population Ecology! This Study Guide will help you master your understanding of the chapter's Driving Questions, using interactive Infographics and activities, as well as targeted assessment questions. Click "Next" to get started, or select a Driving Question from the drop-down menu to the right.
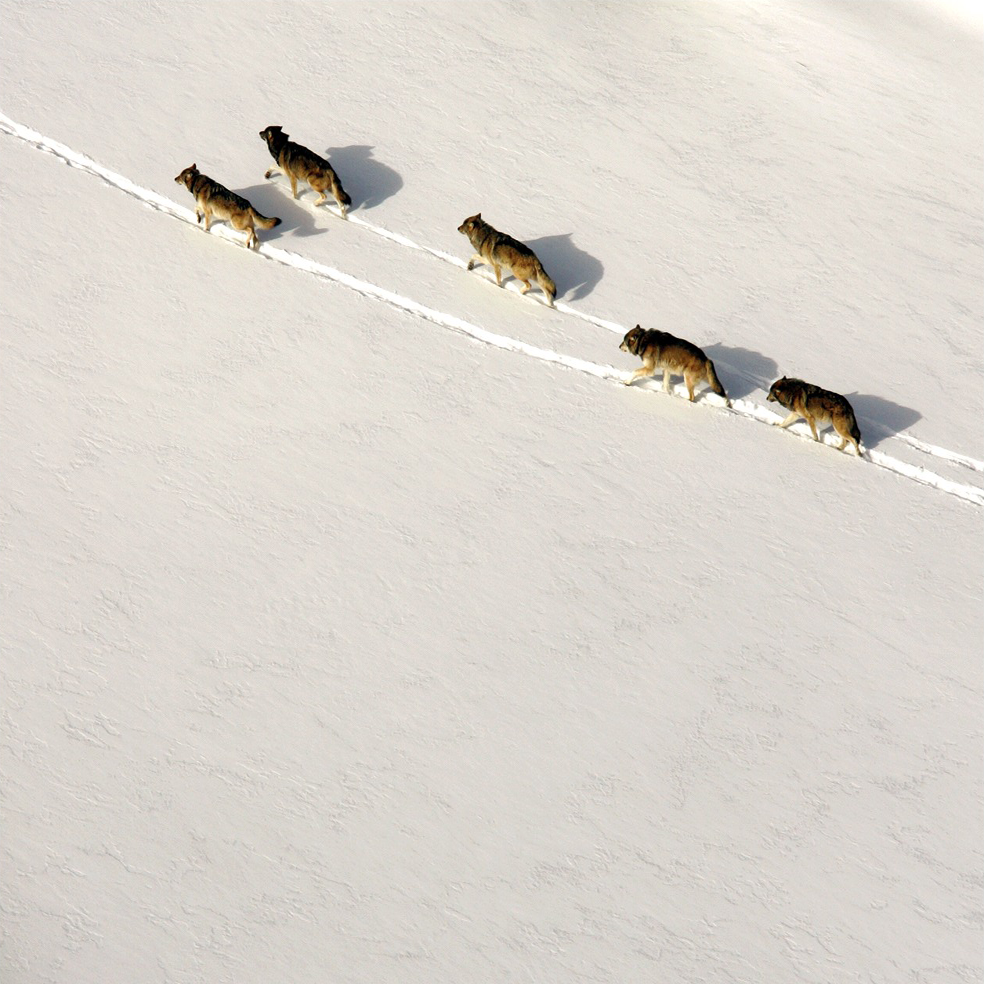
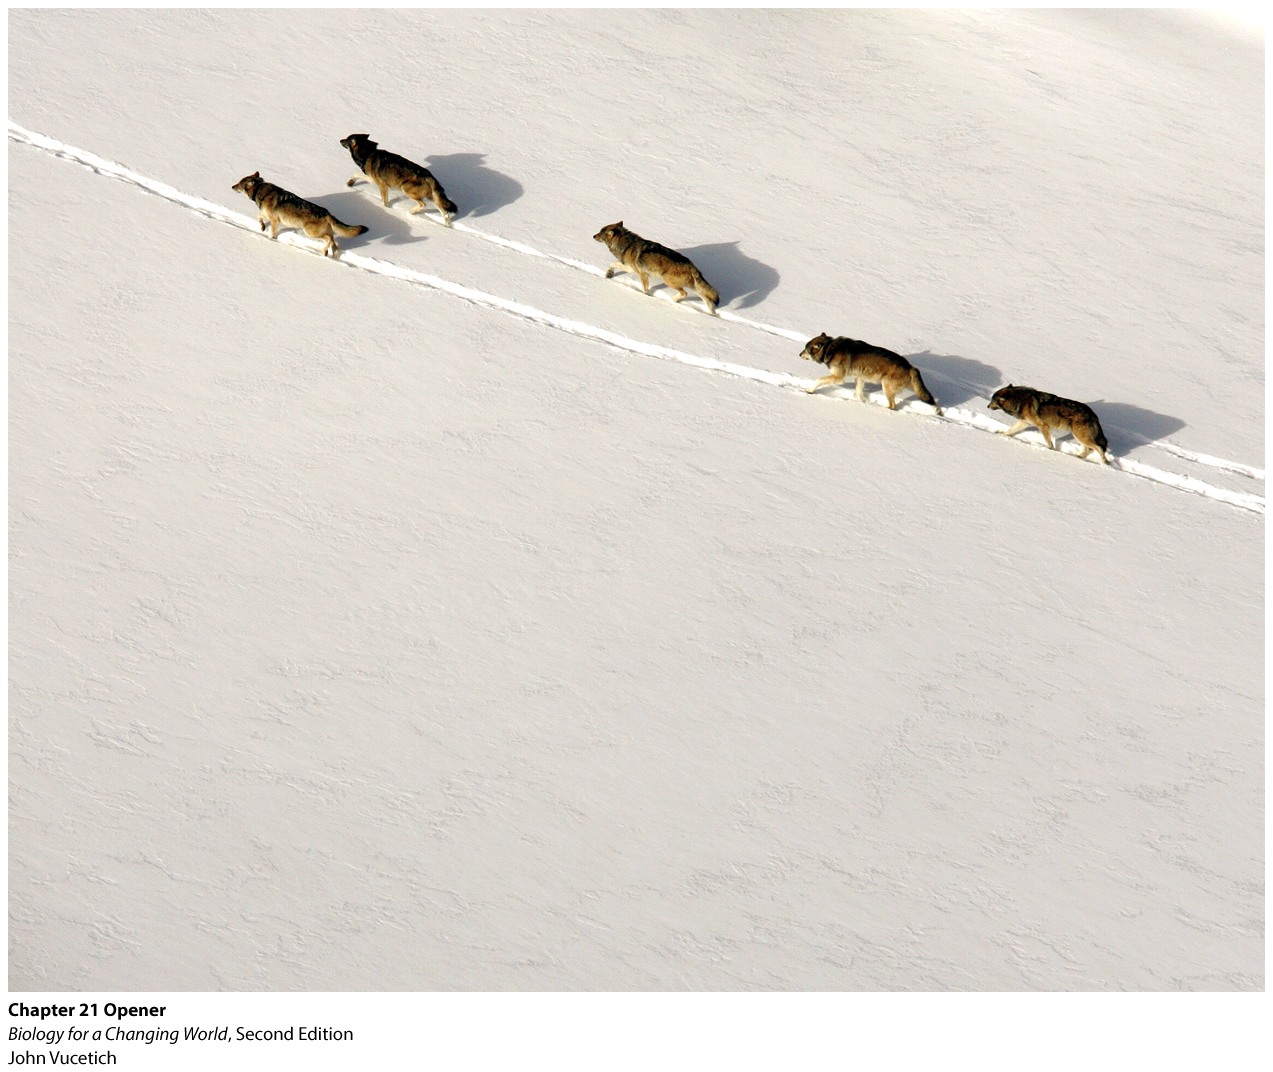
On the Tracks of Wolves and Moose:
Ecologists learn big lessons from a small island
DRIVING QUESTIONS
- What is ecology and what do ecologists study?
- What are the different patterns of population growth?
- What factors influence population growth and population size?
1.2 Driving Question 1:
Driving Question 1
What is ecology and what do ecologists study?
Why should you care?
The study of ecology is becoming increasingly important as concern grows about the effect of environmental degradation not only on human health and well-being but also on the well-being of all species that call Earth home. Ecology is studied at many levels; understanding the levels of ecology will help you understand and interpret ecological information.
Have you ever looked at an aerial photo of North America at night? If you have, you might have noticed that there is an interesting pattern of lights: all of the coasts are outlined; there’s a scattering of lights throughout the eastern half of the continent; and most of the western interior is dark. The superficial reason for this pattern is immediately apparent—the lights indicate where the biggest populations of people live. But the deeper questions of what historical, cultural, economic, and geographical factors have caused this distribution of people are much more complex. Just as a sociologist might want to study the distribution of people, ecologists often need to study the distribution pattern of various organisms; they tailor their studies to the nature of the organisms so that they can learn the right questions to ask about why those organisms live where they do.
Understanding how organisms distribute themselves reveals how they interact. Think again of human interactions—how would four strangers arrange themselves in an elevator? Would you expect them to bunch up in the same corner or to distribute themselves uniformly into each corner of the space? People tend to want to give each other space in close quarters. If you increase the scale, however, to human interactions at the neighborhood or town level, you will see that their distribution tends to be clumped: there are subdivisions, apartment complexes, and townhouses. This tends to be because of the distribution of suitable land for housing, the need for utilities, and zoning restrictions. Just as there is much to learn from the way people arrange themselves, there is much to learn about the way other organisms are distributed.
What should you know?
To fully answer this Driving Question, you should be able to:
- Explain the nested levels of ecology.
- Explain how distribution patterns may affect population sampling methods.
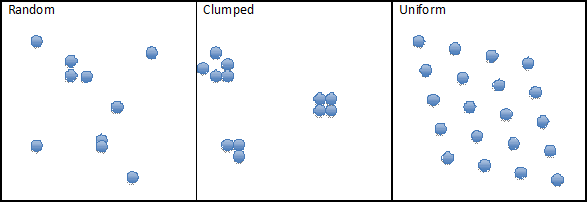
- Explain the difference between random, clumped, and uniform distribution patterns.
- Explain what factors cause distribution patterns.
Infographic Focus
The infographics most pertinent to the Driving Question are 21.1 to 21.3.
Test Your Vocabulary
Choose the correct term for each of the following definitions:
| Term | Definition |
|---|---|
| Interacting populations of different species in a defined habitat. | |
| A group of organisms of the same species living and interacting in a particular area. | |
| The way that organisms are apportioned in geographic space, which depends on resources and interactions with other members of the population. | |
| The study of the interactions between organisms and between organisms and their nonliving environment. | |
| All of the living organisms in an area and the nonliving components of the environment with which they interact. | |
| The physical environment where an organism lives and to which it is adapted. |
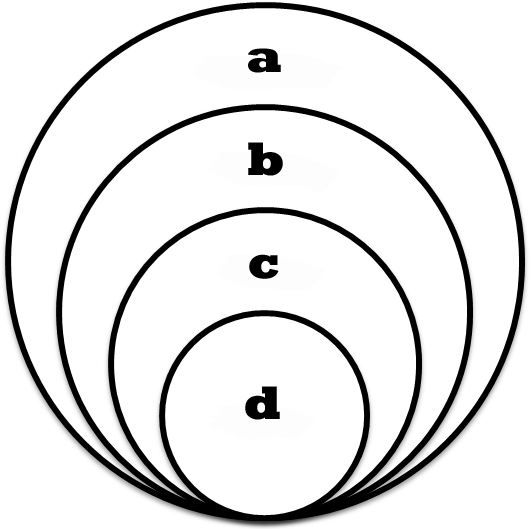
Explain the nested levels of ecology.
1.
The different levels of ecology can be thought of as nested within each other. In each of the circles below arrange the following levels from most inclusive in the largest circle to least inclusive in the smallest circle. Match each circle with the appropriate level of ecology and the best example of how an ecologist might conduct research at that level.
| Research Example | Level of Ecology | Circle |
|---|---|---|
| Studying how a white oak tree deals with water stress. | ||
| Studying how white oak trees, squirrels, and birds interact with each other and deal with a drought. | ||
| Studying how a group of white oak trees compete with each other for space and light in a forest. | ||
| Studying how white oak trees manage to reproduce in spite of heavy seed predation from squirrels. |
Explain how distribution patterns may affect population sampling methods.
2.
Why is it more difficult to spot a moose than a wolf on Isle Royale?
Explain the difference between random, clumped, and uniform distribution patterns.
4.
In your notebook, using dots, flowers, or animals, draw the difference between distribution patterns.
Explain what factors create distribution pattern.
5.
Propose an example of organisms that would display the following patterns:
Random:
Clumped:
Uniform:
Review Questions
6.
Ecologists may study the effect of environment on a single organism as well as an entire community of species.
| A. |
| B. |
1.3 Driving Question 2:
Driving Question 2
What are the different patterns of population growth?
Why should you care?
All populations grow, and all have upper limits to their size—including human populations. The global human population has been growing exponentially for the last century, and evidence suggests that we are approaching the upper limit of sustainable population. Learning about population growth and carrying capacity in other organisms will help you understand what humans are facing.
What should you know?
To fully answer this Driving Question, you should be able to:
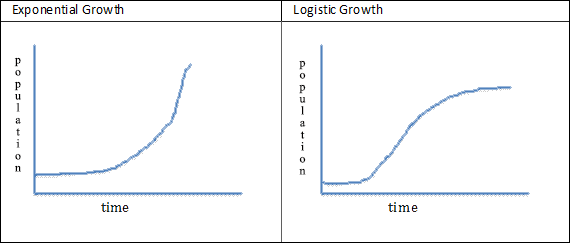
- Compare and contrast exponential and logistic population growth.
- Understand how population growth rate is calculated.
- Define and explain the role of carrying capacity in the growth of populations.
Infographic Focus
The Infographic most pertinent to the Driving Question is 21.4.
Test Your Vocabulary
Choose the correct term for each of the following definitions:
| Term | Definition |
|---|---|
| The movement of individuals into a population. | |
| The physical environment where an organism lives and to which it is adapted. | |
| The maximum population size that a given environment or habitat can support given its food supply and other natural resources. | |
| The movement of individuals out of a population. | |
| The difference between the birthrate and the death rate of a given population; also known as the rate of natural increase. | |
| The unrestricted growth of a population increasing at a constant growth rate. | |
| A pattern of growth that starts off fast and then levels off as the population reaches the carrying capacity of the environment. |
Compare and contrast exponential and logistic population growth.
11.
In your notebook, draw an exponential population growth curve and a logistic population growth curve in the spaces below. Be sure to label both axes appropriately.
Understand how population growth rate is calculated.
13.
Select the correct answers below to describe the relationship of birth rate and death rate to total population growth rate, assuming immigration and emigration are not occurring.
- =
Define and explain the role of carrying capacity in the growth of populations.
15.
What is carrying capacity in terms of population growth?
Review Questions
19.
In the absence of immigration and emigration, a growth rate of zero means:
| A. |
| B. |
| C. |
| D. |
1.4 Driving Question 3:
Driving Question 3
What factors influence population growth and population size?
Why should you care?
A central truth in ecology is that everything is connected. We often forget that we are part of nature, not outside of it. Just as ants modify their environment by building colonies, we modify our environment by building cities. The level and complexity of the ways we change the world to suit our purposes may be greater than that of most animals, but we are still animals living in and affecting nature. Realizing that we are still connected to the environment is important.
For populations of predators like the wolves on Isle Royal to survive, they must have an adequate supply of prey. If they were to eat all the moose and other prey animals on the island, they would die out. Instead, populations of wolves and moose periodically fluctuate, maintaining an equilibrium.
Both living and nonliving conditions can influence the populations of an organism, whether they are wolves, trees, moose, or people. For humans, abiotic factors that affect population growth are natural disasters, climate, and availability of resources like clean water. Biotic factors include diseases, birthrates, and death rates.
Global climate change is recognized by most scientists, especially ecologists, and ecologists are especially concerned about the effects of changing climate on ecosystems. Why should you care? Some of the predicted effects include the proliferation of organisms that spread disease, such as mosquitoes that carry malaria.
What should you know?
To fully answer this Driving Question, you should be able to:
- Interpret fluctuating patterns of prey and predator populations over time.
- Explain the inter-relationship between wolf population size, moose population size, and tree growth at Isle Royale.
- Explain the various ways the health of moose and wolves can be assessed indirectly from their scat, urine, and blood.
- Explain how abiotic and biotic factors influence wolf and moose population size.
- Differentiate between density-dependent and density-independent influences on wolf and moose population sizes.
Infographic Focus
The infographics most pertinent to the Driving Question are 21.5 to 21.9.
Test Your Vocabulary
Choose the correct term for each of the following definitions:
| Term | Definition |
|---|---|
| A factor that can influence population size and growth regardless of the numbers and crowding within a population (e.g., weather). | |
| The number of organisms per unit of area. | |
| Refers to the living components of an environment. | |
| Refers to the nonliving components of an environment, such as temperature and precipitation. | |
| A factor whose influence on population size and growth depends on the number and crowding of individuals in the population (e.g., predation). |
Interpret fluctuating patterns of prey and predator populations over time.
21.
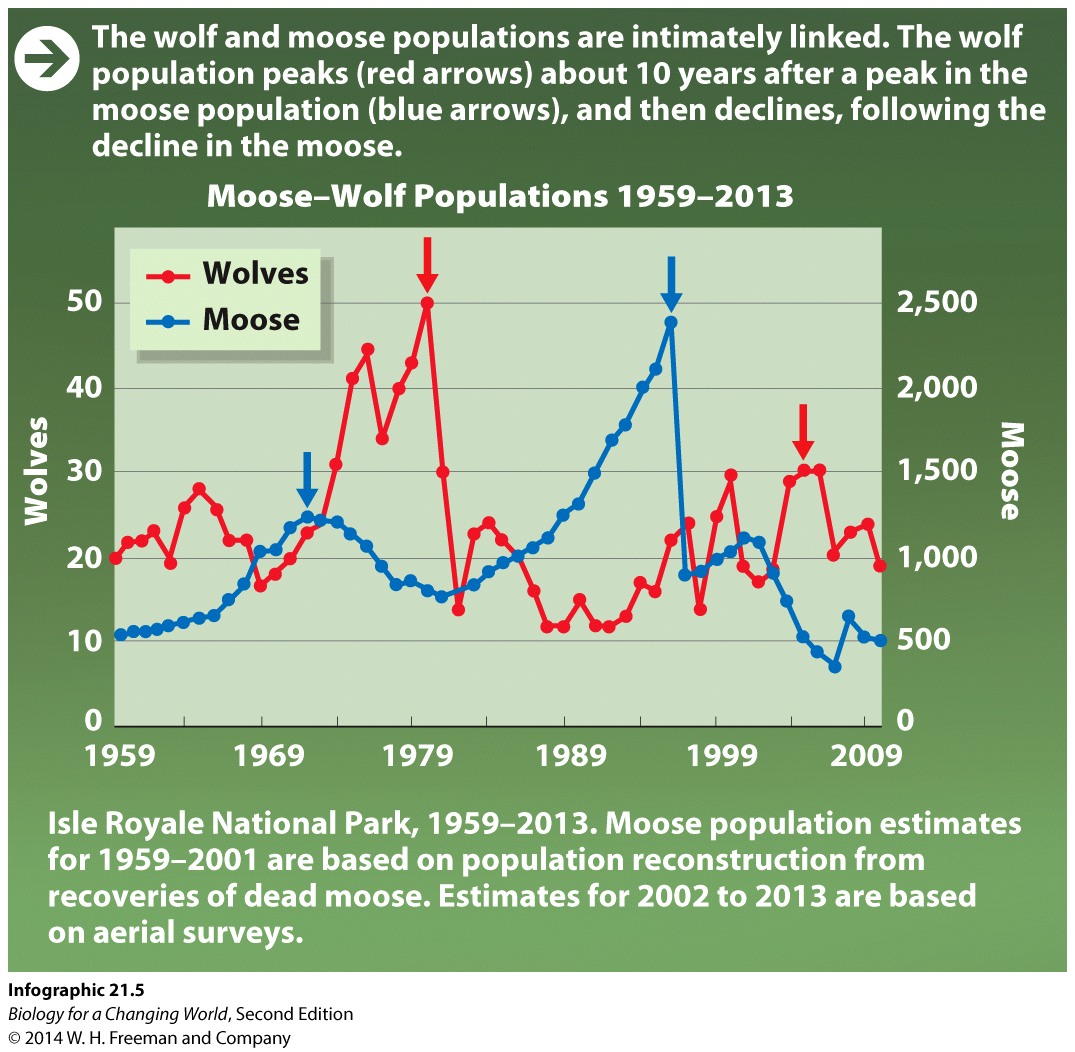
Examine Infographic 21.5; describe any patterns that you see in the populations of wolves and moose.
Explain the inter-relationship between wolf population size, moose population size, and tree growth at Isle Royale.
23.
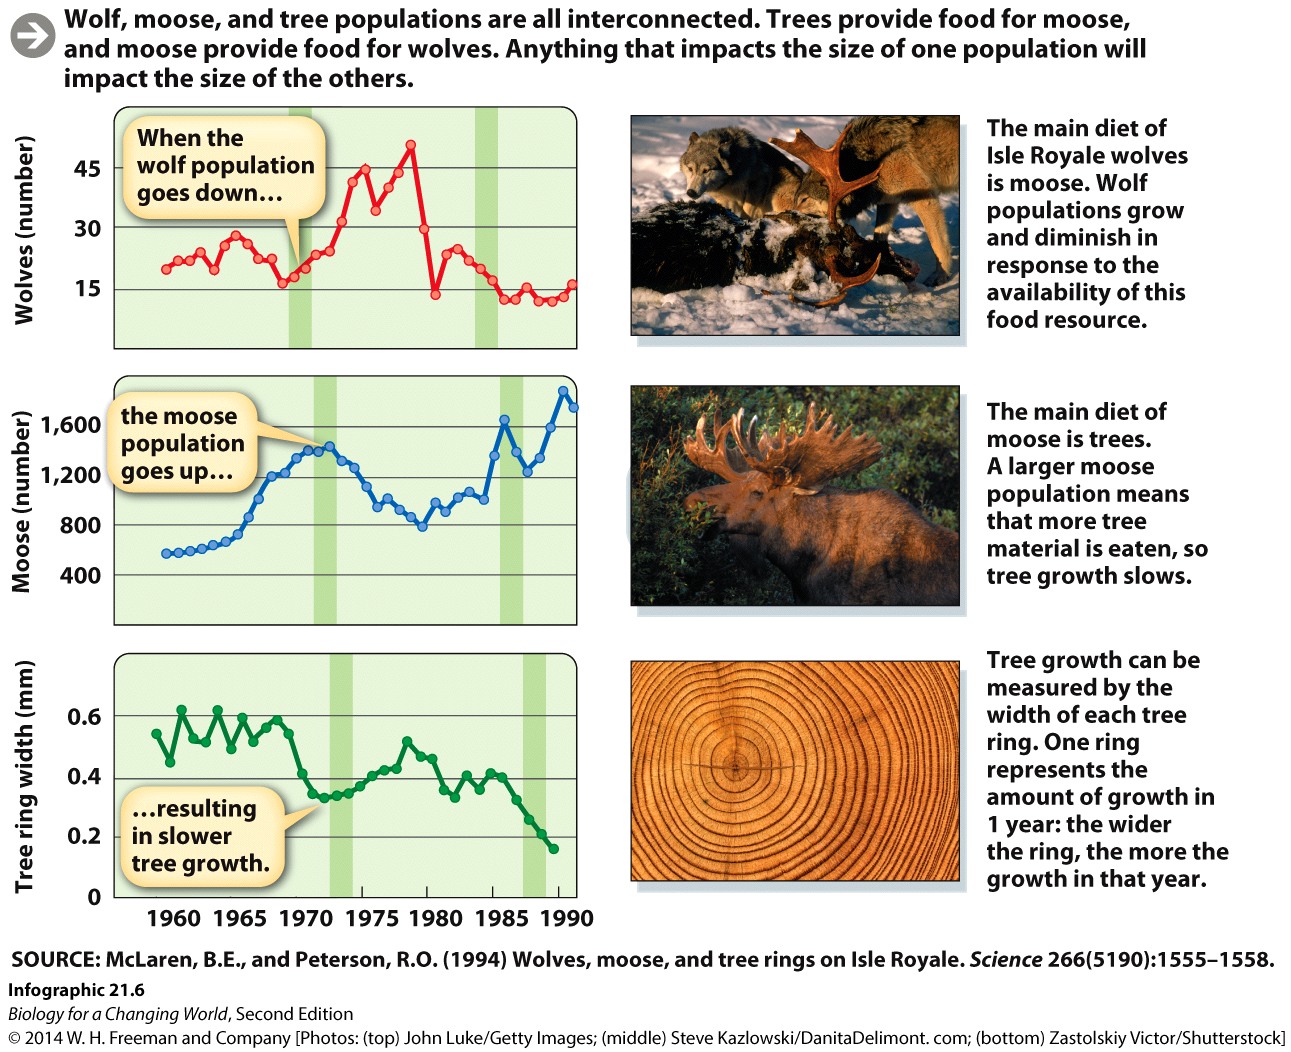
Examine Infographic 21.6. Add notes to each arrow below, describing how trees, wolves, and moose affect each other’s populations.
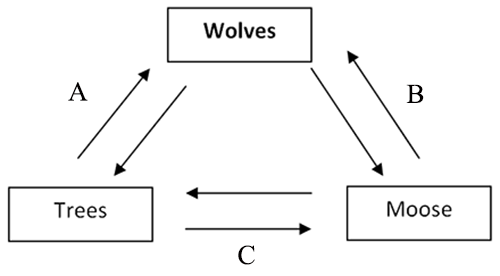
A:
A = Trees affect the wolf population by acting as a food source for the wolves’ prey; moose. Wolves affect tree populations by reducing the number of moose that eat the trees and thus the tree population can grow.
B = The wolves affect the moose population through predation. Populations of moose decline when there are a lot of wolves feeding on them. Moose affect the wolf population by acting as their food source. If there are not a lot of moose to eat, the wolf population declines.
C = Trees affect the moose population by acting as a food source. The larger the tree population, the more the moose have to eat to increase their population. Moose affect the tree population by eating them. The more moose there are, the more trees they eat, the fewer trees that are in the population.
B:
A = Trees affect the wolf population by acting as a food source for the wolves’ prey; moose. Wolves affect tree populations by reducing the number of moose that eat the trees and thus the tree population can grow.
B = The wolves affect the moose population through predation. Populations of moose decline when there are a lot of wolves feeding on them. Moose affect the wolf population by acting as their food source. If there are not a lot of moose to eat, the wolf population declines.
C = Trees affect the moose population by acting as a food source. The larger the tree population, the more the moose have to eat to increase their population. Moose affect the tree population by eating them. The more moose there are, the more trees they eat, the fewer trees that are in the population.
C:
A = Trees affect the wolf population by acting as a food source for the wolves’ prey; moose. Wolves affect tree populations by reducing the number of moose that eat the trees and thus the tree population can grow.
B = The wolves affect the moose population through predation. Populations of moose decline when there are a lot of wolves feeding on them. Moose affect the wolf population by acting as their food source. If there are not a lot of moose to eat, the wolf population declines.
C = Trees affect the moose population by acting as a food source. The larger the tree population, the more the moose have to eat to increase their population. Moose affect the tree population by eating them. The more moose there are, the more trees they eat, the fewer trees that are in the population.
Explain the various ways the health of moose and wolves can be assessed indirectly from their scat, urine, and blood.
24.
What information can be gathered from the droppings of wolves and moose?
Information that can be gathered from wolves and moose droppings includes diet composition, health of the animal, genetic profile of the animal and nutritional health.
Explain how abiotic and biotic factors influence wolf and moose population size.
27.
Complete the table below about factors that control populations of wolf and moose at Isle Royale.
| Name of Factor | Abiotic or Biotic? | Give an example of how it could affect one population? (Increases or decreases and why) |
| Temperature |
Fill in:
The cell is bigger and there is double the amount of organelles.
|
|
| Fire |
Fill in:
The cell is bigger and there is double the amount of organelles.
|
|
| Predators |
Fill in:
The cell is bigger and there is double the amount of organelles.
|
|
| Food |
Fill in:
The cell is bigger and there is double the amount of organelles.
|
|
| Disease |
Fill in:
The cell is bigger and there is double the amount of organelles.
|
|
| Precipitation |
Fill in:
The cell is bigger and there is double the amount of organelles.
|
Differentiate between density-dependent and density-independent influences on wolf and moose population sizes.
28.
Describe the difference between a density-dependent and a density-independent control on a population.
Thought Question: Can humans have an effect on abiotic factors? Why or Why not?
Review Questions
29.
In the long-term, it is better for the moose population to exist in high-density numbers so that they may protect themselves from wolf attacks.
| A. |
| B. |
Activity results are being submitted...