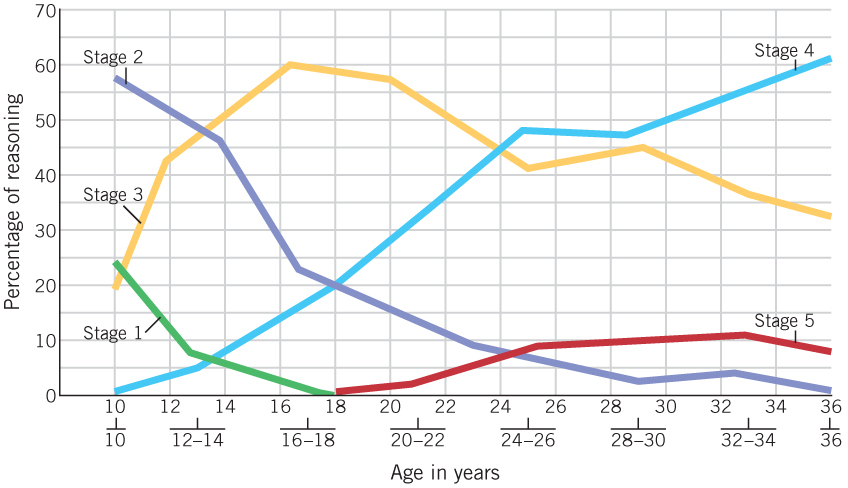
FIGURE 14.1 Mean percentage of moral reasoning at each stage for each age group
This graph shows age trends in moral reasoning in Kohlberg’s longitudinal sample. (Adapted from Colby et al., 1983)