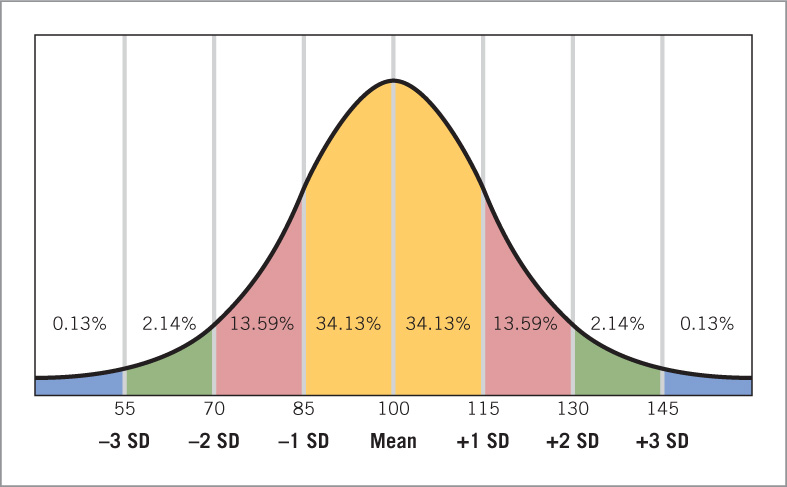
FIGURE 8.3 A normal distribution of IQ scores Like other measurable human characteristics, IQ scores fall into a normal distribution. Here, the numbers along the base of the graph correspond to IQ scores. The number just below each IQ score indicates how many standard deviation units that score is below or above the mean. Thus, an IQ score of 55 is 3 standard deviations below the mean. The percentages in each interval indicate the percentage of children whose scores fall within that interval; for example, less than 1% of children have IQ scores below 55 and slightly more than 2% score between 55 and 70.