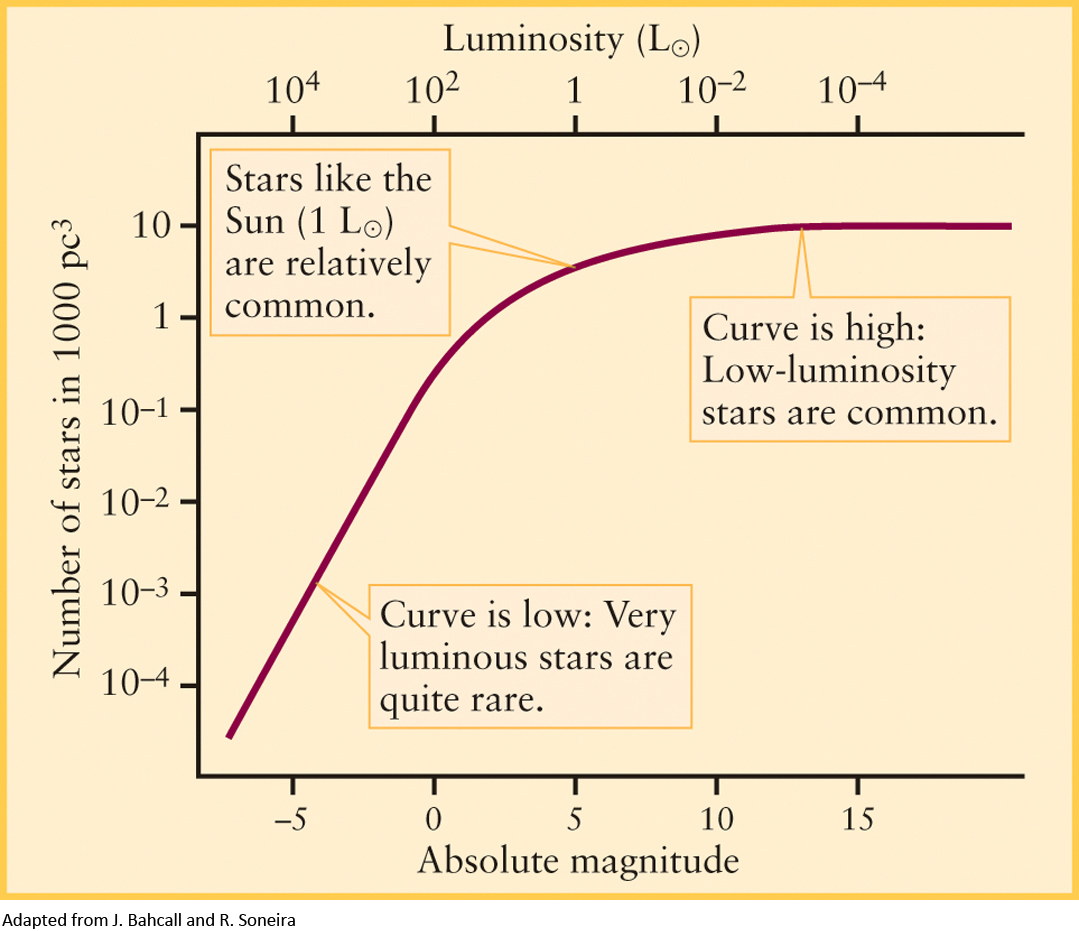
Figure 10-7 The Luminosity Function This graph shows how many stars of a given luminosity lie within a nearby representative volume of 1000 pc3. The scale at the bottom of the graph shows absolute magnitude, an alternative measure of a star’s luminosity (described in Section 10-2).