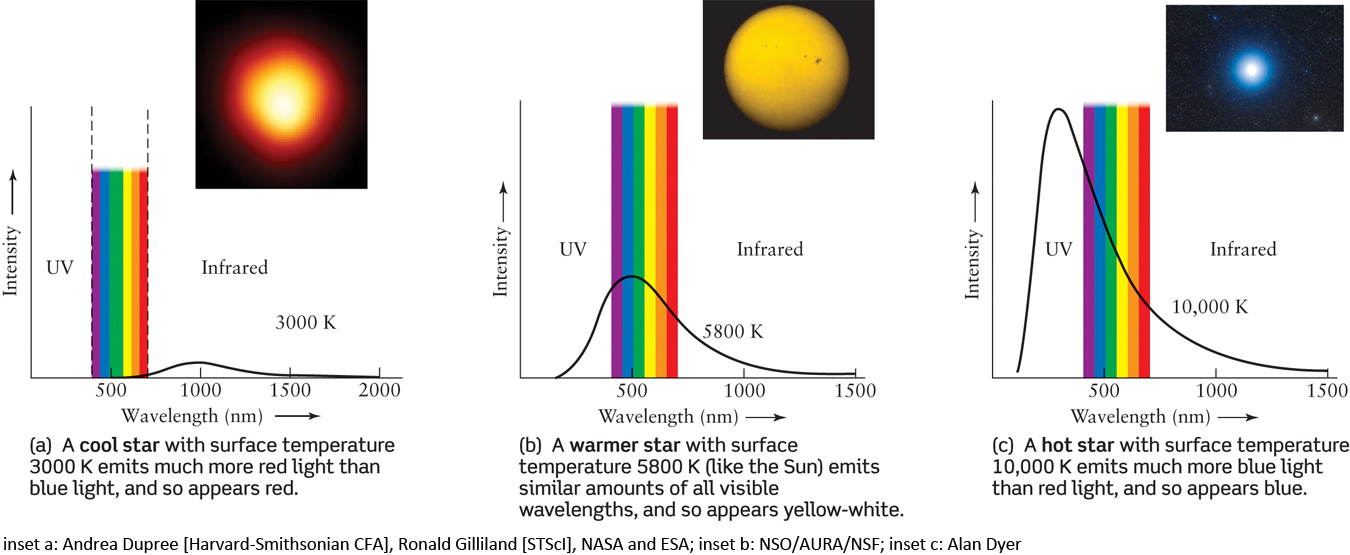
Figure 10-8 Temperature and Color These graphs show the intensity of light emitted by three hypothetical stars plotted against wavelength (compare with Figure 2-10). The rainbow band indicates the range of visible wavelengths. The star’s apparent color depends on whether the intensity curve has larger values at the short-wavelength or long-wavelength side of the visible spectrum. The insets show stars of about these surface temperatures. UV stands for ultraviolet, which extends from 10 nm to 400 nm.