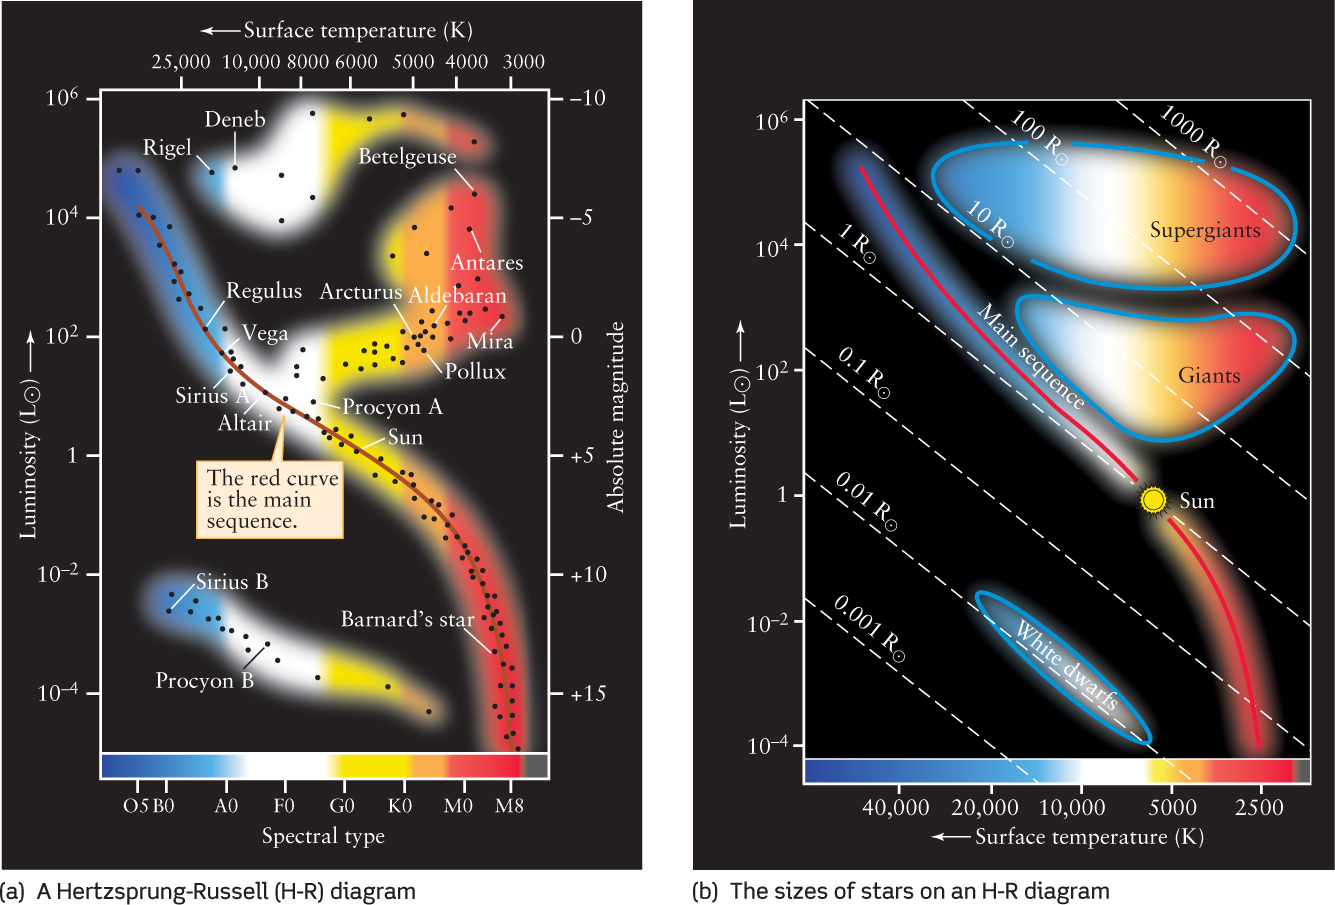
Figure 10-15 Hertzsprung-Russell (H-R) Diagrams On an H-R diagram, the luminosities (or absolute magnitudes) of stars are plotted against their spectral types (or surface temperatures). (a) The data points are grouped in just a few regions on the graph, showing that luminosity and spectral type are correlated. Most stars lie along the red curve called the main sequence. Giants like Arcturus, as well as supergiants like Rigel and Betelgeuse, are above the main sequence, and white dwarfs like Sirius B are below it. (b) The blue curves on this H-R diagram enclose the regions of the diagram in which different types of stars are found. The dashed diagonal lines indicate different stellar radii. For a given stellar radius, as the surface temperature increases (that is, moving from right to left in the diagram), the star glows more intensely and the luminosity increases (that is, moving upward in the diagram). Note that the Sun is intermediate in luminosity, surface temperature, and radius.