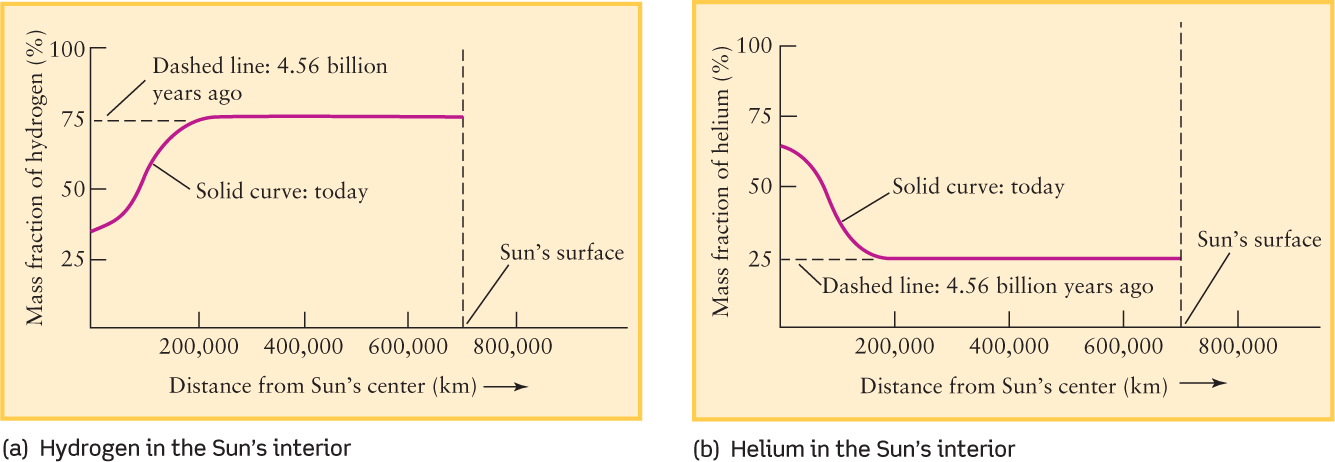
Figure 11-13 Changes in the Sun’s Chemical Composition These graphs show the percentage by mass of (a) hydrogen and (b) helium at different points within the Sun’s interior. The dashed horizontal lines show that these percentages were the same throughout the Sun’s volume when it first formed. As the solid curves show, over the past 4.56 × 10⁹ years, thermonuclear reactions at the core have depleted hydrogen in the core and increased the amount of helium in the core.