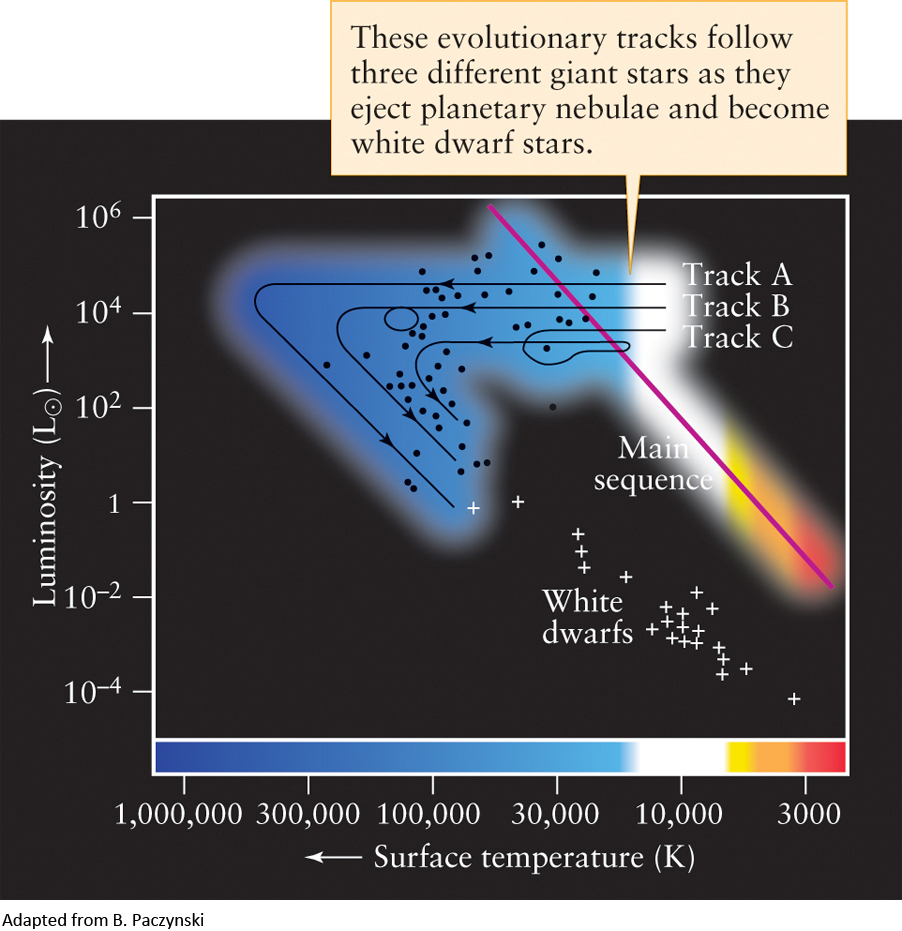
Figure 11-29 Evolution from Giants to White Dwarfs This H-R diagram shows the evolutionary tracks of three low-mass giant stars as they eject planetary nebulae. The table gives the extent of mass loss in each case. The dots represent the central stars of planetary nebulae whose surface temperatures and luminosities have been determined; the crosses represent white dwarfs of known temperature and luminosity.