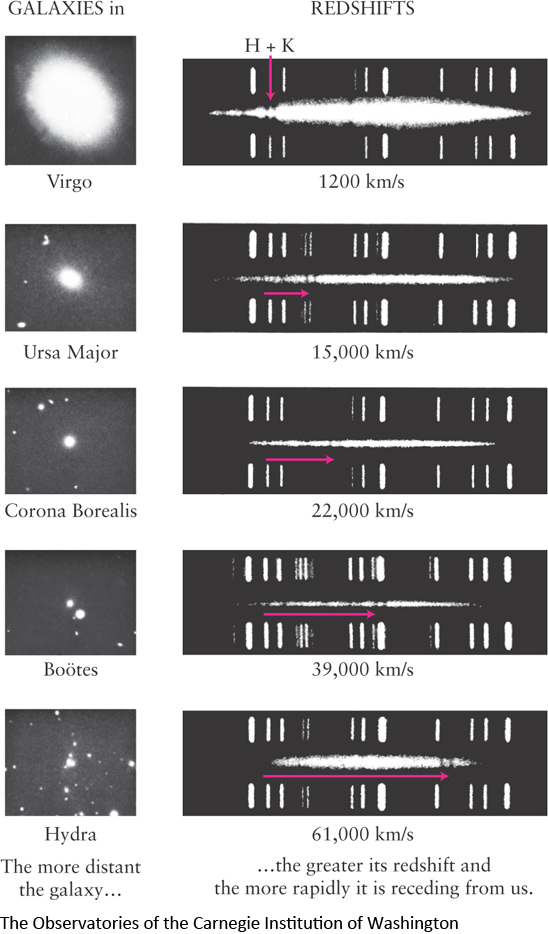
Figure 15-2 RIVUXG Relating the Distances and Redshifts of Galaxies These five galaxies are arranged, from top to bottom, in order of increasing distance from us. All are shown at the same magnification. Each galaxy’s spectrum is a bright band with dark absorption lines; the bright lines above and below it are a comparison spectrum of a light source at the observatory on Earth. The horizontal red arrows show how much the H and K lines of singly ionized calcium are redshifted in each galaxy’s spectrum. Below each spectrum is the recessional velocity calculated from the redshift. The more distant a galaxy is, the greater its redshift.