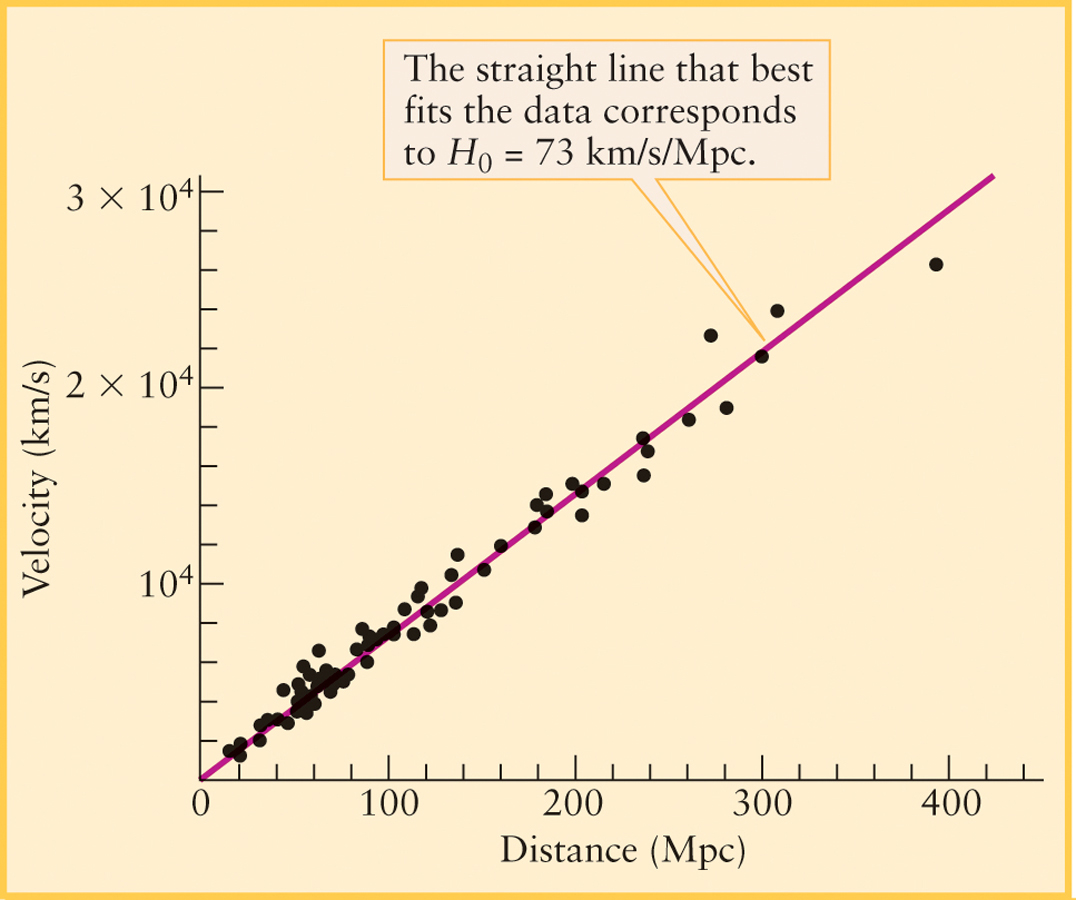
Figure 15-4 The Hubble Law This graph plots the distances and recessional velocities of a sample of galaxies. The straight line is the best fit to the data. This linear relationship between distance and recessional velocity is called the Hubble law.