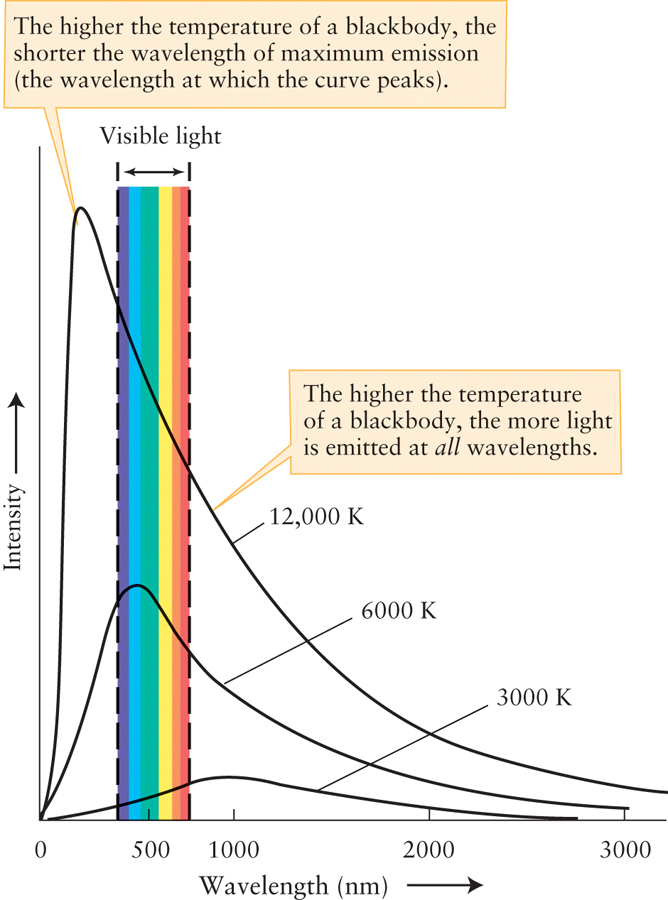
Figure 2-10 Blackbody Curves Each of these curves shows the intensity of light at every wavelength that is emitted by a blackbody (an idealized case of a dense object) at a particular temperature. The rainbow-colored band shows the range of visible wavelengths. The vertical scale has been compressed so that all three curves can be seen; the peak intensity for the 12,000-K curve is actually about 1000 times greater than the peak intensity for the 3000-K curve.