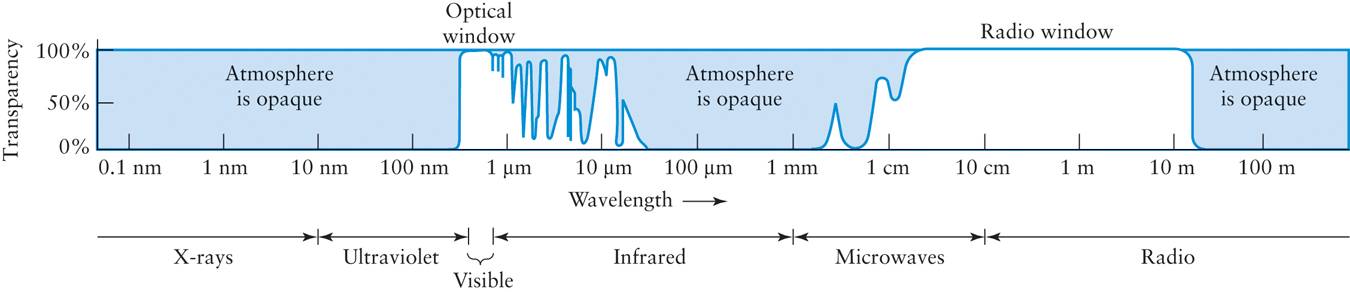
Figure 2-24 The Transparency of Earth’s Atmosphere This graph shows the percentages of light that can penetrate Earth’s atmosphere at different wavelengths. Regions in which the curve is high are called “windows,” because the atmosphere is relatively transparent at those wavelengths. There are also three wavelength ranges in which the atmosphere is opaque and the curve is near zero: (1) at wavelengths less than about 290 nm, which are absorbed by atmospheric oxygen and nitrogen; (2) between the optical and radio window, due to absorption by water vapor and carbon dioxide; and (3) at wavelengths longer than about 20 m, which are reflected back into space by ionized gases in the upper atmosphere.