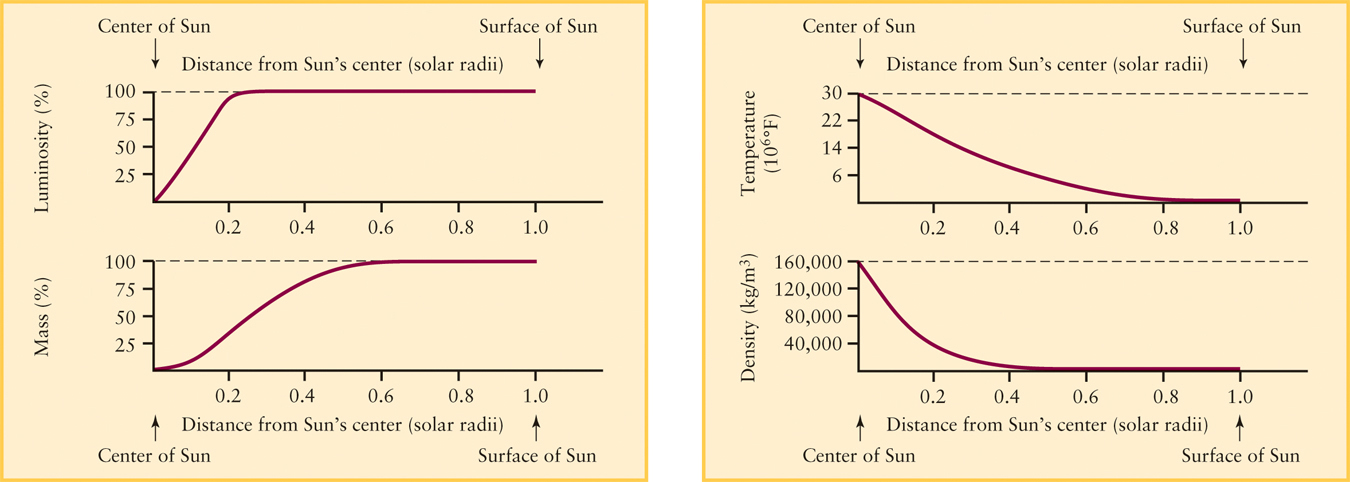
Figure 9-2 A Theoretical Model of the Sun’s Interior These graphs depict what percentage of the Sun’s total luminosity is produced within each distance from the center (upper a), what percentage of the total mass lies within each distance from the center (lower a), the temperature at each distance (upper b), and the density at each distance (lower b). (See Table 9-1 for a numerical version of this model.)