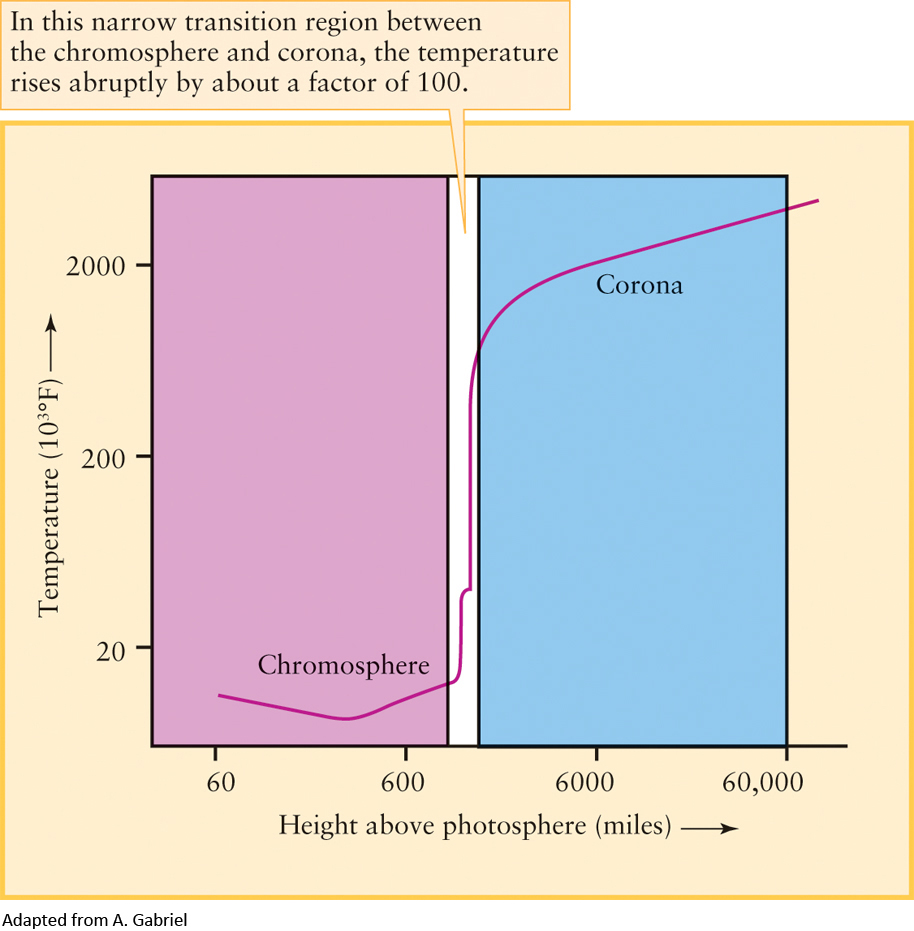
Figure 9-11 Temperatures in the Sun’s Upper Atmosphere This graph shows how temperature varies with altitude in the Sun’s chromosphere and corona and in the narrow transition region between them. In order to show a large range of values, both the vertical and horizontal scales are nonlinear.