15-4 The microwave radiation that fills all space is compelling evidence of a hot Big Bang
One of the major advances in twentieth-century astronomy was the discovery of the origin of the heavy elements. We know today that essentially all the heavy elements are created by thermonuclear reactions at the centers of stars and in supernovae. The starting point of all these reactions is the fusion of hydrogen into helium. But as astronomers began to understand the details of thermonuclear synthesis in the 1960s, they were faced with a dilemma: There is far more helium in the universe than could have been created by hydrogen fusion in stars.
For example, the Sun consists of about 74% hydrogen and 25% helium by mass, leaving only 1% for all the remaining heavier elements combined. This 1% can be understood as material produced inside earlier generations of massive stars that long ago cast these heavy elements out into space when they became supernovae. Some freshly made helium, produced by the thermonuclear fusion of hydrogen within the stars, certainly accompanied these heavy elements. But calculations showed that the amount of helium produced in this way was not nearly enough to account for one-quarter of the Sun’s mass. Because it was thought that the universe originally contained only hydrogen—the simplest of all the chemical elements—the presence of so much helium posed a major dilemma.
A Hot Big Bang and the Cosmic Microwave Background
Today, it seems obvious that the universe immediately following the Big Bang must have been so incredibly hot that thermonuclear reactions occurred everywhere throughout space. In the 1960s, the Princeton University physicists Robert Dicke and P. J. E. Peebles discovered that they could indeed account for today’s high abundance of helium by assuming that the early universe had been at least as hot as the Sun’s center, where helium is currently being produced. The hot early universe must therefore have been filled with many high-energy, short-wavelength photons.
The universe has expanded so much since those ancient times that all those short-wavelength photons have had their wavelengths stretched by a tremendous factor. As a result, they have become low-energy, long-wavelength photons. The temperature of this cosmic energy field is now only a few degrees above absolute zero. By Wien’s law (described in Section 2-3), the majority of light emitted at such a low temperature should have its peak intensity at microwave wavelengths of approximately 1 millimeter. Hence, this energy field, which fills all of space, is called the cosmic microwave background or cosmic background radiation. In the early 1960s, Dicke and his colleagues began designing an antenna to detect this microwave light.
368
Meanwhile, scientists working on something completely unrelated to astronomy, Arno Penzias and Robert Wilson of Bell Telephone Laboratories in New Jersey, were building a new antenna designed to relay telephone calls to Earth-orbiting communications satellites (see Figure 15-13). Penzias and Wilson were deeply puzzled when, no matter where in the sky they pointed their antenna, they detected faint background noise. Thanks to a colleague, they happened to learn about the work of Dicke and Peebles and came to realize that they had discovered the cooled-down cosmic background radiation left over from the hot Big Bang.
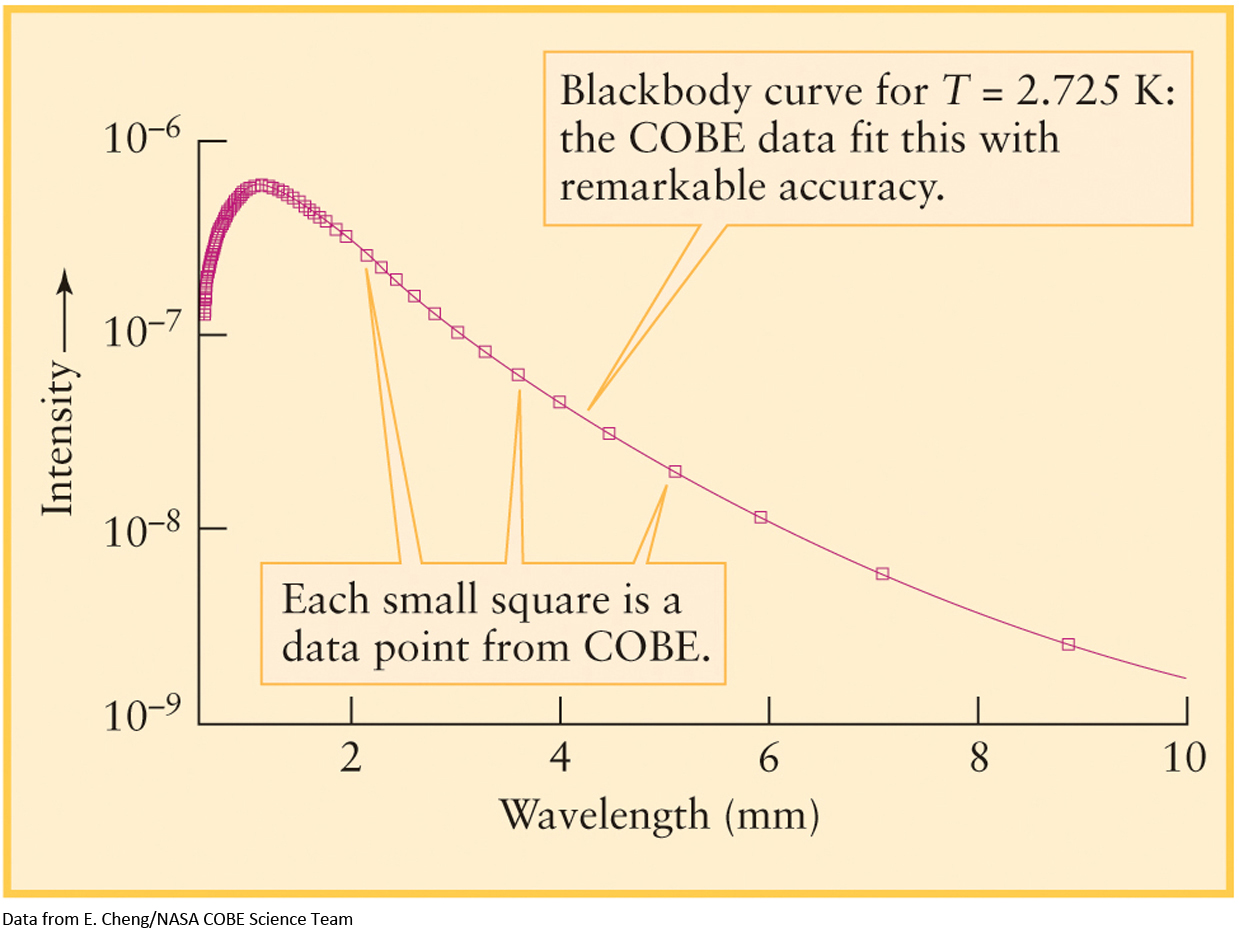
The first high-precision measurements of the cosmic microwave background came from the Cosmic Background Explorer (COBE, pronounced “coe-bee”) satellite (see Figure 15-13). Data from COBE’s spectrometer, shown in Figure 15-8, demonstrate that this ancient microwave light has the spectrum of a blackbody with a temperature of 2.725 K—just a few degrees above absolute zero as predicted.
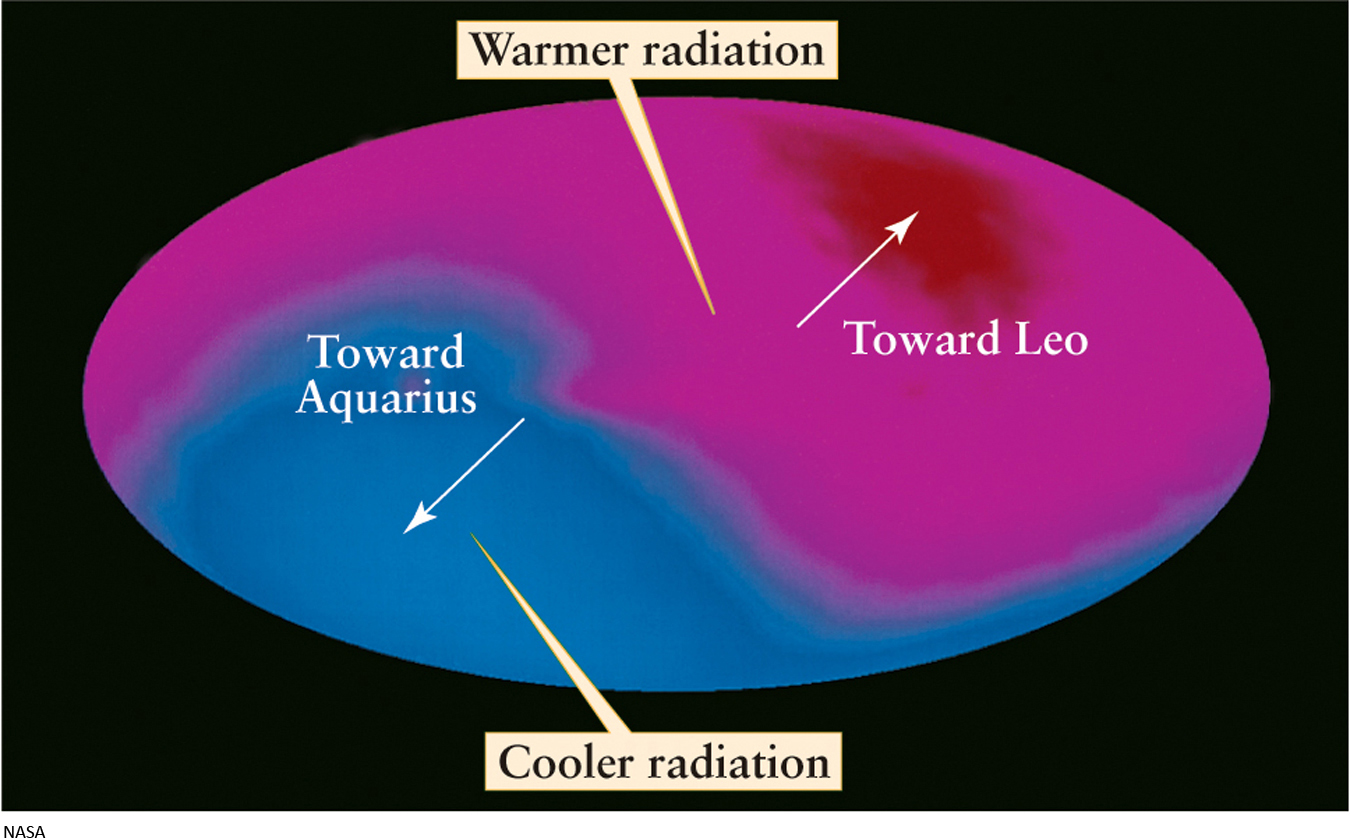
An important feature of the microwave background is that its intensity is almost perfectly isotropic, that is, the same in all directions. In other words, we detect nearly the same background intensity from all parts of the sky. However, extremely accurate measurements first made from highflying airplanes, and later from high-altitude balloons and from COBE, reveal a very slight variation in temperature across the sky. The microwave background appears slightly warmer than average toward the constellation of Leo and slightly cooler than average in the opposite direction toward Aquarius. Between the warm spot in Leo and the cool spot in Aquarius, the background temperature declines smoothly across the sky. Figure 15-9 is a map of the microwave sky showing this variation.
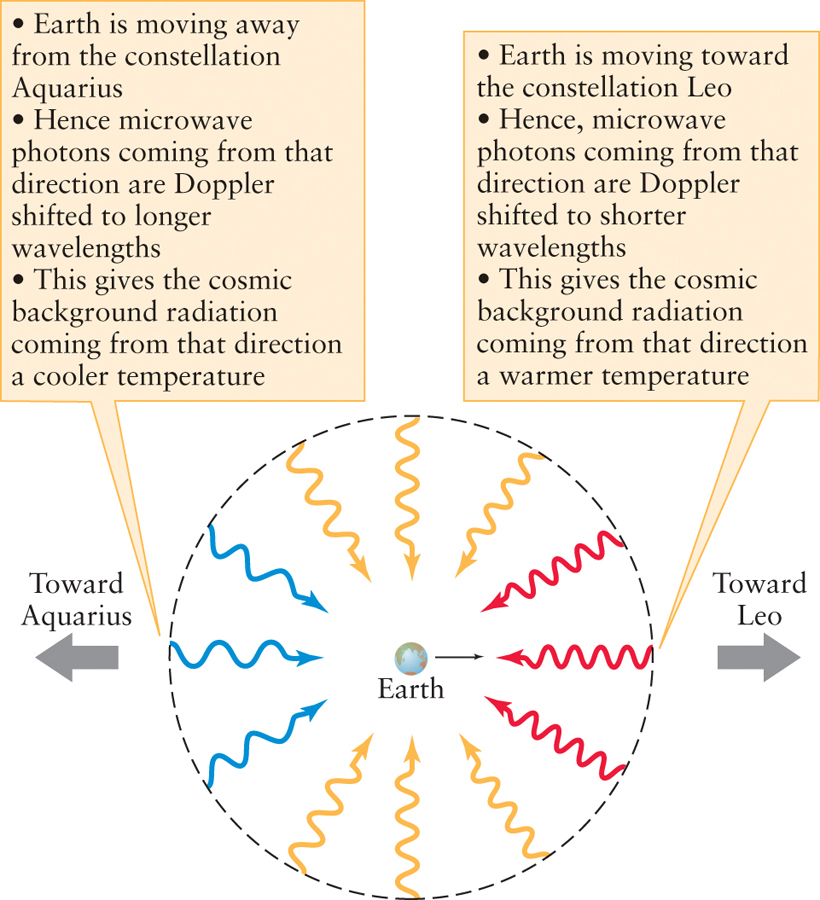
This apparent variation in temperature is caused by Earth’s motion through the cosmos. If we were at rest with respect to the microwave background, the microwave light observed would be even more nearly isotropic. Because we are moving through this field of microwave light, however, we see a Doppler shift. Specifically, we see shorter-than-average wavelengths in the direction toward which we are moving, as drawn in Figure 15-10. A decrease in wavelength corresponds to an increase in photon energy and thus an increase in the temperature. The slight temperature excess observed, about 0.00337 K, corresponds to a speed of 371 km/s, which is about 830,000 mi/h. Conversely, we see longer-than-average wavelengths in that part of the sky from which we are receding. An increase in wavelength corresponds to a decline in photon energy and, hence, a decline in temperature.
369
Our solar system is thus traveling away from Aquarius and toward Leo at a speed of 371 km/s. Taking into account the known velocity of the Sun around the center of our Galaxy, we find that the entire Local Group of galaxies, including our Milky Way Galaxy, is moving at about 620 km/s toward the Hydra-Centaurus supercluster, which is about 1.4 million mi/h. Observations show that thousands of other galaxies are being carried in this direction, as is the Hydra-Centaurus supercluster itself. This tremendous flow of matter is thought to be due to the gravitational pull of an enormous collection of visible galaxies and dark matter lying in that direction. The existence of such concentrations of mass, as well as the existence of superclusters of galaxies, shows that the universe is rather “lumpy” on scales of 100 Mpc (326 million ly) or smaller. It is only on larger scales that the universe is homogeneous and isotropic.
Question
ConceptCheck 15-7: If the early universe was filled with high-energy, short-wavelength photons, why are these observed today to be low-energy, long-wavelength microwave photons?