Chapter 1. Correlation and Regression
Introduction
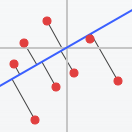
Click on the graphing area below to create a scatterplot of data points. The correlation coefficient for the data you enter will be shown on the left. Click "Show least-squares line" to show the least-squares regression line for your data.
Click the "Quiz Me" button to complete the activity.A scatterplot displays the form, direction, and strength of the relationship between two quantitative variables. Straight-line (linear) relationships are particularly important because a straight line is a simple pattern that is quite common. The correlation measures the direction and strength of the linear relationship. The least-squares regression line is the line that makes the sum of the squares of the vertical distances of the data points from the line as small as possible.
1.
Create a scatterplot with at least 8 points where the correlation is between 0.5 and 0.7.
2.
Now clear the scatterplot and create a new one with at least 8 points where the correlation is between -0.1 and -0.3.