Chapter 1. Infographics
Introduction
Infographic Demo Activity
This shows off DigFir's capabilities with Infographic images.
Certainty in Science
Infographic 2.2: Certainty in Science
Question 1Certainty in Science
Click on the item or items in this Infographic that represent the varying degrees of certainty in science (some levels of certainty are not considered a part of science).
{"title":"no clue","description":"Obviously no clue does not reflect certainty.","type":"incorrect","color":"#99CCFF","code":"[{\"shape\":\"rect\",\"coords\":\"11,16,89,55\"}]"} {"title":"hypothesis","description":"A hypothesis indicates some certainty... One of the other items reflects some certainty as well.","type":"correct","color":"#993300","code":"[{\"shape\":\"rect\",\"coords\":\"91,16,395,55\"}]"} {"title":"theory","description":"A theory is about as much certainty as you can get in science... One of the other items reflects some certainty as well.","type":"correct","color":"#333300","code":"[{\"shape\":\"rect\",\"coords\":\"396,15,470,54\"}]"} {"title":"absolute proof","description":"Absolute proof is not attainable in science.","type":"incorrect","color":"#000080","code":"[{\"shape\":\"rect\",\"coords\":\"471,15,600,54\"}]"}

There are degrees of certainty in science—we know some ideas are better than others. The more evidence we have in support of an idea, especially when the evidence comes from different lines of inquiry, the more certain we are that we are on the right track. But since all scientific information is open to further evaluation, we do not expect or require “absolute” proof.)
The Scientific Process
Infographic 2.3: The Scientific Process
Question 2
Click on the marker in this Infographic that represents the step in the scientific process where scientists analyze data.
{"title":"analyze data","description":"Once a study is conducted and data gathered, the data are evaluated to determine whether they confirm or fail to confirm the hypothesis.","type":"correct","color":"#99CCFF","code":"[{\"shape\":\"rect\",\"coords\":\"526,200,590,316\"}]"} {"title":"design and carry out experiment","description":"Try again.","type":"incorrect","color":"#993300","code":"[{\"shape\":\"rect\",\"coords\":\"397,200,518,315\"}]"} {"title":"develop a hypothesis","description":"Try again.","type":"incorrect","color":"#333300","code":"[{\"shape\":\"rect\",\"coords\":\"265,200,393,315\"}]"} {"title":"draw conclusions","description":"Try again.","type":"incorrect","color":"#000080","code":"[{\"shape\":\"rect\",\"coords\":\"593,200,668,315\"}]"} {"title":"observations generate questions","description":"Try again.","type":"incorrect","color":"#333333","code":"[{\"shape\":\"rect\",\"coords\":\"9,200,93,315\"}]"} {"title":"test alternate hypothesis","description":"Try again.","type":"incorrect","color":"#800000","code":"[{\"shape\":\"circle\",\"coords\":\"433,414,25\"}]"} {"title":"test new prediction or hypothesis","description":"Try again.","type":"incorrect","color":"#FF6600","code":"[{\"shape\":\"circle\",\"coords\":\"372,106,24\"}]"}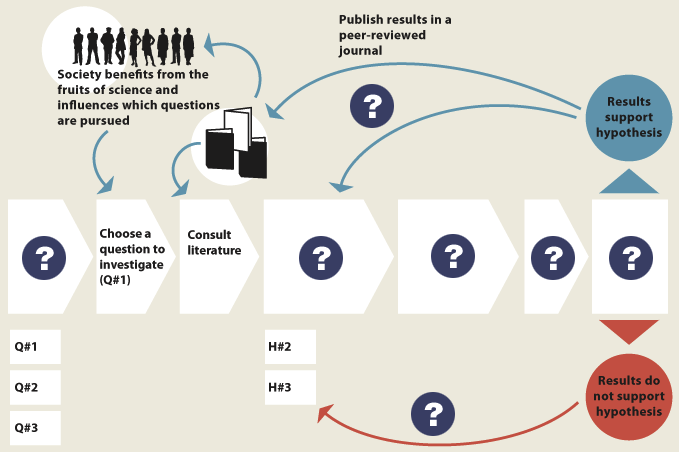
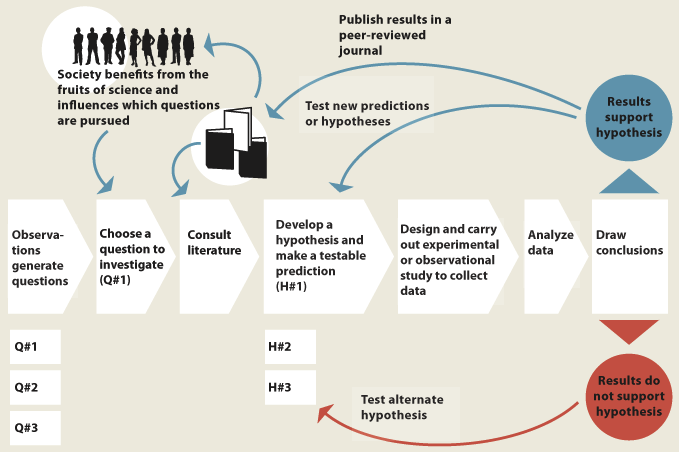
Full caption from infographic can appear here.
1.1 Activity Completed!
Activity results are being submitted...