Chapter 1. Chapter 8

Step 1

Solved Problems
true
true
You must read each slide, and complete any questions on the slide, in sequence.

Question

Consider the following graph: The graph represents a competitive firm. The marginal cost (MC) curve, average total cost (ATC) curve, and price (P) line corresponding to each level of output (Q) are given in the graph.
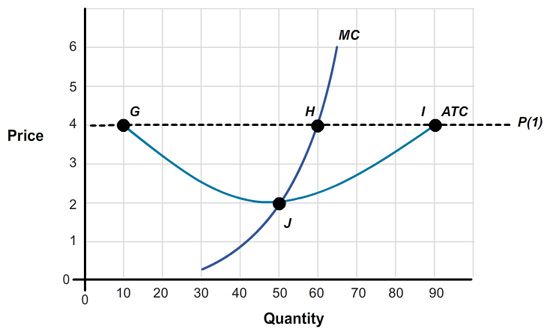
The graph shows ‘Quantity’ on the horizontal axis, from 0 to 90 in increments of 10. The vertical axis shows the ‘Price’, ranging from 0 to 6 in single increments. A horizontal dotted line at price level 4 is labeled P(1). The ATC curve starts at point G on P(1) which corresponds to the value 10 on the horizontal axis. It ends at point I on P(1) which corresponds to 90 on the horizontal axis. The MC curve starts at value 30 on the horizontal axis and approximately at 0 on the vertical axis.  It slopes upward to intersect the ATC curve at point J which corresponds to 50 on the horizontal axis and 2 on the vertical axis. It also intersects the dotted line P(1) at point H. This point corresponds to the value 60 on the horizontal axis.

A competitive firm maximizes profits if P equals U26uvk3JWocGK6yagR1dsA==.

3
The correct formula is P = MC. If Q is too low, the firm will forego profits, and if Q is too high, the firm will lose money.

Step 2

Question

The graph shows ‘Quantity’ on the horizontal axis, from 0 to 90 in increments of 10. The vertical axis shows the ‘Price’, ranging from 0 to 6 in single increments. A horizontal dotted line at price level 4 is labeled P(1). The ATC curve starts at point G on P(1) which corresponds to the value 10 on the horizontal axis. It ends at point I on P(1) which corresponds to 90 on the horizontal axis. The MC curve starts at value 30 on the horizontal axis and approximately at 0 on the vertical axis.  It slopes upward to intersect the ATC curve at point J which corresponds to 50 on the horizontal axis and 2 on the vertical axis. It also intersects the dotted line P(1) at point H. This point corresponds to the value 60 on the horizontal axis.

If P = $4, point P6RcF6ZuUiMAH6k+l8Ub8cwBdgTHPQv7FN0uGlPtmPLHW3nGsOZI3FyOzvymvszx determines the profit-maximizing quantity.

3
P crosses MC at point H, which determines the profit-maximizing quantity.

Step 3

Question

The graph shows ‘Quantity’ on the horizontal axis, from 0 to 90 in increments of 10. The vertical axis shows the ‘Price’, ranging from 0 to 6 in single increments. A horizontal dotted line at price level 4 is labeled P(1). The ATC curve starts at point G on P(1) which corresponds to the value 10 on the horizontal axis. It ends at point I on P(1) which corresponds to 90 on the horizontal axis. The MC curve starts at value 30 on the horizontal axis and approximately at 0 on the vertical axis.  It slopes upward to intersect the ATC curve at point J which corresponds to 50 on the horizontal axis and 2 on the vertical axis. It also intersects the dotted line P(1) at point H. This point corresponds to the value 60 on the horizontal axis.

If P = $4, the profit-maximizing quantity in this graph is SeGVZpRlQr2NC0nVWJqkbA== units.

3
Point H is located at a P of $4 and a Q of 60 units. ATC is minimized at Q = 50, but point H lies to the right of this.

Step 4

Question

The graph shows ‘Quantity’ on the horizontal axis, from 0 to 90 in increments of 10. The vertical axis shows the ‘Price’, ranging from 0 to 6 in single increments. A horizontal dotted line at price level 4 is labeled P(1). The ATC curve starts at point G on P(1) which corresponds to the value 10 on the horizontal axis. It ends at point I on P(1) which corresponds to 90 on the horizontal axis. The MC curve starts at value 30 on the horizontal axis and approximately at 0 on the vertical axis.  It slopes upward to intersect the ATC curve at point J which corresponds to 50 on the horizontal axis and 2 on the vertical axis. It also intersects the dotted line P(1) at point H. This point corresponds to the value 60 on the horizontal axis.

If P = $4 and Q = 60 units, how much is this firm’s revenue? Answer using a whole number. $krOSu23SrvtefqEkW5ws5Diw40xZY8p1BKePxg==

3
Revenue = P × Q. Here, revenue = $4 × 60 = $240.

Step 5

Question

The graph shows ‘Quantity’ on the horizontal axis, from 0 to 90 in increments of 10. The vertical axis shows the ‘Price’, ranging from 0 to 6 in single increments. A horizontal dotted line at price level 4 is labeled P(1). The ATC curve starts at point G on P(1) which corresponds to the value 10 on the horizontal axis. It ends at point I on P(1) which corresponds to 90 on the horizontal axis. The MC curve starts at value 30 on the horizontal axis and approximately at 0 on the vertical axis.  It slopes upward to intersect the ATC curve at point J which corresponds to 50 on the horizontal axis and 2 on the vertical axis. It also intersects the dotted line P(1) at point H. This point corresponds to the value 60 on the horizontal axis.

In this graph, ATC at Q = 60 units is closest to buItxLvf0WvRi2caMqvtq33VrD+XobIX.

3
ATC is minimized at P = $2.00, but point H lies to the right of this. At Q = 60 units, ATC has risen.

Step 6

Question

The graph shows ‘Quantity’ on the horizontal axis, from 0 to 90 in increments of 10. The vertical axis shows the ‘Price’, ranging from 0 to 6 in single increments. A horizontal dotted line at price level 4 is labeled P(1). The ATC curve starts at point G on P(1) which corresponds to the value 10 on the horizontal axis. It ends at point I on P(1) which corresponds to 90 on the horizontal axis. The MC curve starts at value 30 on the horizontal axis and approximately at 0 on the vertical axis.  It slopes upward to intersect the ATC curve at point J which corresponds to 50 on the horizontal axis and 2 on the vertical axis. It also intersects the dotted line P(1) at point H. This point corresponds to the value 60 on the horizontal axis.

If Q = 60 units and ATC = $2.25, how much is this firm’s total cost (TC)? Answer using a whole number. $S1y7VnbpjG4QH9k2x8UA2VEMCzfSMVjzkpsYGQ==

3
Since ATC = TC/Q, then TC = ATC × Q. Here, total cost = $2.25 × 60 = $135.

Step 7

Question

The graph shows ‘Quantity’ on the horizontal axis, from 0 to 90 in increments of 10. The vertical axis shows the ‘Price’, ranging from 0 to 6 in single increments. A horizontal dotted line at price level 4 is labeled P(1). The ATC curve starts at point G on P(1) which corresponds to the value 10 on the horizontal axis. It ends at point I on P(1) which corresponds to 90 on the horizontal axis. The MC curve starts at value 30 on the horizontal axis and approximately at 0 on the vertical axis.  It slopes upward to intersect the ATC curve at point J which corresponds to 50 on the horizontal axis and 2 on the vertical axis. It also intersects the dotted line P(1) at point H. This point corresponds to the value 60 on the horizontal axis.

If Q = 60 units and ATC = $2.25, how much is this firm’s profit? Answer using a whole number. $mah7dl7hyKoezSDEL8vgoA==

3
Profit can either be revenue – cost or (P - ATC) × Q. Using the first method, profit = $240 − $135 = $105. Using the second, profit per unit = $4 − $2.25 = $1.75, and profit = $1.75 × 60 = $105.

Step 8

Question

The graph shows ‘Quantity’ on the horizontal axis, from 0 to 90 in increments of 10. The vertical axis shows the ‘Price’, ranging from 0 to 6 in single increments. A horizontal line at price level 2 is labeled P(2). The ATC curve starts at point G which corresponds to the value 10 on the horizontal axis, and 4 on the vertical axis. It meets the line P(2) at point J. This corresponds to 50 on the horizontal axis. The ATC curve ends at point I which corresponds to 90 on the horizontal axis, and 4 on the vertical axis. The MC curve starts at value 30 on the horizontal axis and approximately at 0 on the vertical axis.  It slopes upward to intersect the ATC curve and P(2) line at point J. Point H is also indicated on the MC curve corresponding to 60 on the horizontal axis and 4 on the vertical axis.

In the long run, a competitive firm maximizes profits if P equals MC, equals jSgAWvYu6Rtj7Bpxsh/3WyKsdW3Q/FEY32QcfBWqgrdnbDBlYL8Dfbehuhzz0zAKgfmL4g==.

3
In the long run, competition forces firms to operate at the lowest (total) costs possible.

Step 9

Question

The graph shows ‘Quantity’ on the horizontal axis, from 0 to 90 in increments of 10. The vertical axis shows the ‘Price’, ranging from 0 to 6 in single increments. A horizontal line at price level 2 is labeled P(2). The ATC curve starts at point G which corresponds to the value 10 on the horizontal axis, and 4 on the vertical axis. It meets the line P(2) at point J. This corresponds to 50 on the horizontal axis. The ATC curve ends at point I which corresponds to 90 on the horizontal axis, and 4 on the vertical axis. The MC curve starts at value 30 on the horizontal axis and approximately at 0 on the vertical axis.  It slopes upward to intersect the ATC curve and P(2) line at point J. Point H is also indicated on the MC curve corresponding to 60 on the horizontal axis and 4 on the vertical axis.

In this graph, minimum ATC occurs when P = P02YILpI5fyoFfPUbdYHRg==.

3
ATC is minimized where Q = 50 units.

Step 10

Question

The graph shows ‘Quantity’ on the horizontal axis, from 0 to 90 in increments of 10. The vertical axis shows the ‘Price’, ranging from 0 to 6 in single increments. A horizontal line at price level 2 is labeled P(2). The ATC curve starts at point G which corresponds to the value 10 on the horizontal axis, and 4 on the vertical axis. It meets the line P(2) at point J. This corresponds to 50 on the horizontal axis. The ATC curve ends at point I which corresponds to 90 on the horizontal axis, and 4 on the vertical axis. The MC curve starts at value 30 on the horizontal axis and approximately at 0 on the vertical axis.  It slopes upward to intersect the ATC curve and P(2) line at point J. Point H is also indicated on the MC curve corresponding to 60 on the horizontal axis and 4 on the vertical axis.

If P = $2, the profit-maximizing quantity in this graph is CT5odGJ3Ovb4S4XX/d4OVA== units.

3
ATC is minimized where Q = 50 units.

Step 11

Question

The graph shows ‘Quantity’ on the horizontal axis, from 0 to 90 in increments of 10. The vertical axis shows the ‘Price’, ranging from 0 to 6 in single increments. A horizontal line at price level 2 is labeled P(2). The ATC curve starts at point G which corresponds to the value 10 on the horizontal axis, and 4 on the vertical axis. It meets the line P(2) at point J. This corresponds to 50 on the horizontal axis. The ATC curve ends at point I which corresponds to 90 on the horizontal axis, and 4 on the vertical axis. The MC curve starts at value 30 on the horizontal axis and approximately at 0 on the vertical axis.  It slopes upward to intersect the ATC curve and P(2) line at point J. Point H is also indicated on the MC curve corresponding to 60 on the horizontal axis and 4 on the vertical axis.

If P = $2 and Q = 50, how much is this firm’s revenue? Answer using a whole number. $MDilpcxJNnDF0tME3CNNvAOpOetQk+mKrbCLtw==

3
P × Q. Here, revenue = $2 × 50 = $100.

Step 12

Question

The graph shows ‘Quantity’ on the horizontal axis, from 0 to 90 in increments of 10. The vertical axis shows the ‘Price’, ranging from 0 to 6 in single increments. A horizontal line at price level 2 is labeled P(2). The ATC curve starts at point G which corresponds to the value 10 on the horizontal axis, and 4 on the vertical axis. It meets the line P(2) at point J. This corresponds to 50 on the horizontal axis. The ATC curve ends at point I which corresponds to 90 on the horizontal axis, and 4 on the vertical axis. The MC curve starts at value 30 on the horizontal axis and approximately at 0 on the vertical axis.  It slopes upward to intersect the ATC curve and P(2) line at point J. Point H is also indicated on the MC curve corresponding to 60 on the horizontal axis and 4 on the vertical axis.

If Q = 50 units and ATC = $2.00, how much is this firm’s total cost (TC)? Answer using a whole number. $HvJ6RDZ5HfzsGIhv2SbOYg==

3
Since ATC = TC/Q, then TC = ATC × Q. Here, TC = $2 × 50 = $100.

Step 13

Question

The graph shows ‘Quantity’ on the horizontal axis, from 0 to 90 in increments of 10. The vertical axis shows the ‘Price’, ranging from 0 to 6 in single increments. A horizontal line at price level 2 is labeled P(2). The ATC curve starts at point G which corresponds to the value 10 on the horizontal axis, and 4 on the vertical axis. It meets the line P(2) at point J. This corresponds to 50 on the horizontal axis. The ATC curve ends at point I which corresponds to 90 on the horizontal axis, and 4 on the vertical axis. The MC curve starts at value 30 on the horizontal axis and approximately at 0 on the vertical axis.  It slopes upward to intersect the ATC curve and P(2) line at point J. Point H is also indicated on the MC curve corresponding to 60 on the horizontal axis and 4 on the vertical axis.

If Q = 50 units and ATC = $2.00, how much is this firm’s profit? Answer as a whole number. $1Wh3cvJ2xF4=

3
Competitive firms earn zero profit in the long run. In addition, cost – revenue = $100 − $100 = $0.