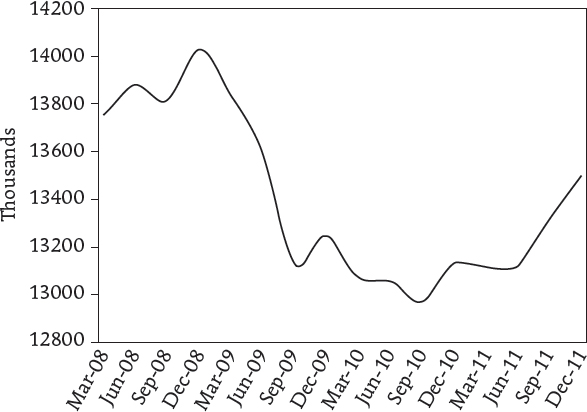
FIGURE 20.2
Line Graph Depicting South Africa Total Employment, 2008–2011
Source:
Accessed November 17, 2013,
www.sec.gov
.