Graphs
Printed Page 413
A graph is a visual representation of the relationship among different numbers, measurements, or quantities. Graphs are especially useful when presenting a great deal of statistical evidence. Some common types of graphs are line graphs, bar graphs, and pie charts.
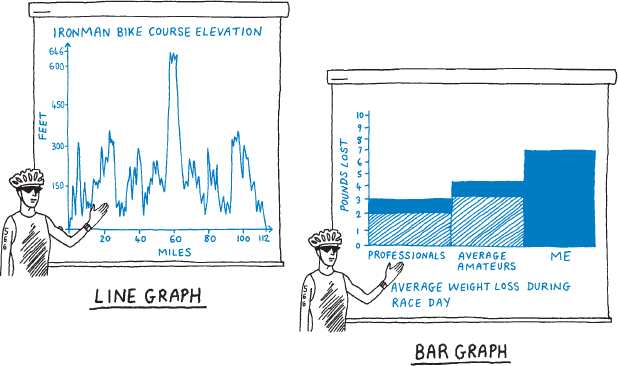
Line Graphs. A line graph uses lines plotted on a pair of axes to show relationships between two elements. For example, you could use a line graph to show the various elevations of the Ironman race or how much profit a company made over a ten-year period.
Bar Graphs. A bar graph consists of parallel bars of varying height or length that compare several pieces of information. For instance, you could use a bar graph to compare the weight loss of three categories of triathletes in a series of races.

Pie Charts. A pie chart (also known as a circle graph) is used to show how percentages and proportions relate to one another and add up to a whole. A pie chart resembles a pie that has been divided up into slices, with each slice representing a percentage of the total sum. You could use a pie chart to show the percentages of different types of foods in a recommended diet for triathletes or how much your town spent in a given year on various services, such as education or road repair.