Chapter 1. The 68-95-99.7 Rule

true
Stat Tutor
true
true

Questions 1-3

1:12

Question 1.1

UQKcg3qp8Ai4RigF2mj7URVW4maJc3PffhsSrJXELQwQEZDxG2lo+s6dUvE8dpNcDQMesqdy+2erz7s1MKLRDK8mMBgn7Nka6Xc2R6tnTTd6FV7mfCeooPK9Pi0t3ann4xGa44fPbZG/gOrq/uBAU8wMiqWf7j0tbh2Qgw==
Correct. 95% of the area of a Normal curve lies within two standard deviations of the mean. This is an important fact.
Incorrect. 95% of the area of a Normal curve lies within two standard deviations of the mean. This is an important fact.
2
Try again.

Question 1.2

Chapter 3 Normal Curve image
O44RNZIbnsLmzzaKluy91nz/0VT3O+NL8eROG9lB888zZFRn6FVzDSUDBZn86fIhXvmOiTQst6v2iPpIXbK1cfdHjZ7l60j4D5ti62doMSx7EpjuEdT5EvLsv63S9OH8nhi7Bw==
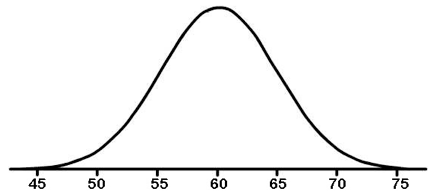
Correct. For this Normal distribution, standard deviation is 5. For all Normal curves, 68% of the area is within one standard deviation of the mean, so 68% of the area under the curve is between 55 and 65.
Incorrect. For this Normal distribution, standard deviation is 5. For all Normal curves, 68% of the area is within one standard deviation of the mean, so 68% of the area under the curve is between 55 and 65.
2
Try again.

Question 1.3

Chapter 3 Normal Curve image
gdc/edF0Kouxtarjq2+lQEtveR6ynHSXabo29D1sPGI8X0d4urDsDZtamgCd1+it0AwMCn1TS9hkAj6zaWkWRLgupImRyglPY/q0MStz53IexOfCEBahoGtjg26cmBzN9aENCW7e5e4Uyn0S
Correct. For all Normal density curves, 99.7% of the area under the curve is within three standard deviations of the mean. Since 45 is three standard deviation lengths below the mean and 75 is three standard deviation lengths above the mean, 99.7% of the area under the curve is between 45 and 75.
Incorrect. For all Normal density curves, 99.7% of the area under the curve is within three standard deviations of the mean. Since 45 is three standard deviation lengths below the mean and 75 is three standard deviation lengths above the mean, 99.7% of the area under the curve is between 45 and 75.
2
Try again.

Questions 4-6

2:41

Question 1.4

Chapter 3 Normal Curve image
Uq6ssb3JzZT5hUzgTL0bGDvergwUwxJnS82hsbifb2HocOOuky36nkkLMyCyD8Ih8g+eseTQMttrQuCG1uGC6TCpFeL8g9Sn/FWc85u6wPKf6dKhv+nkRsibLlmUMX576lH6cUQU+FOTWxl+iZU8pQ==
Correct. Half of the area of the curve is less than 60 and half is greater than 60.
Incorrect. Half of the area of the curve is less than 60 and half is greater than 60.
2
Try again.

Question 1.5

Chapter 3 Normal Curve image
65ivRjX5g40PHvAa9bgOxDty3rLJFETgj2TJd+aKX4gLw/7YB8rpwPcmqjRnwflivPnDwXupCz+gmGsSHcpQkRXu1uaessgqfARl8+L2VXl931Qwz6UqBwzSUQC/bU081EwLdA/lUX0ABquzvzOacKYy3PQ=
Correct. 68% of the area is between 55 and 65. Half of this area of 68% is 34%.
Incorrect. 68% of the area is between 55 and 65. Half of this area of 68% is 34%.
2
Try again.

Question 1.6

Chapter 3 Normal Curve image
uv9fRFMFZ8SvBbAmmKh21E+OdVfYljQ6mkRWgcC2yrlAA6YAWs7KQ3B+khBMa4GjT3LKYDgL8E2RXaSMCzpZ+uyu+QSmo3iFG71shX2NItOtq+z9Cv22Knto5iK8lYvAfiPziWCGLkBarlE1uoGLlA==
Correct. Half of the curve is 50%. 50% minus 34% is 16%. Or you could add 0.15% + 2.35% + 13.5% = 16%
Incorrect. Half of the curve is 50%. 50% minus 34% is 16%. Or you could add 0.15% + 2.35% + 13.5% = 16%
2
Try again.

Questions 7-8

3:21

Question 1.7

Chapter 3 Normal Curve image
03IVlePaURGxlyo35Lnv0Y9ifTYIZ7CTr5kafOkJOJ/zUUg7bHECMfYjY+jAm+Gaz0A24AabiOsYTrtaEMHbBK/dbKbHrfVmqHtKxmQVDghgIPMq+vyHdmD4ogUYYheNyCkYCVYG+mZT31qqlQhti13Ry2c=
Correct. 95% of the area under any Normal curve is within two standard deviations of the mean. That means 100% – 95% = 5% is the area less than 50 and greater than 70. Half of this is the area less than 50. So, 5%/2 = 2.5%.
Incorrect. 95% of the area under any Normal curve is within two standard deviations of the mean. That means 100% – 95% = 5% is the area less than 50 and greater than 70. Half of this is the area less than 50. So, 5%/2 = 2.5%.
2
Try again.

Question 1.8

Chapter 3 Normal Curve image
5BLF/Ql08o+5GO1bAptC8pV0BFduHcm48zeQIzXLADVOfwiNaHjDYSOkfTo5TsqAdl0h47bGKq7r+i7JFr4kfE8rPPc7IrvI0KxvcPTfZxrbjG32J3mT2y6sf793ZVEF1MAgl0FrPXyenINmcZSG7VlfLCc=
Correct. 50% of the curve is less than 60. 68% is between 55 and 65. Half of 68% or 34% is between 60 and 65. 50% + 34% = 84%
Incorrect. 50% of the curve is less than 60. 68% is between 55 and 65. Half of 68% or 34% is between 60 and 65. 50% + 34% = 84%
2
Try again.

Questions 9-11

4:47

Question 1.9

Chapter 3 Normal Curve image
a5upr4GXk/dLY6svWcLNlBpKVQ0vFgYDdIVksGJRjtoNJ0YnlAQMHPUYgEFfBcb+r4rDQ+1Qu8z/3HClfwHqqJlf6w5z8/WNGsW9tZy5aVMLlrK+R/xVf9/vq/6X9PR6uXliqb/LiZ/zNiKxlUj72g==
Correct. First, find the area under the curve less than 50. 100% – 95% = 5%. And half of 5% is 2.5%. Second, find the area under the curve less than 55. 100% – 68% = 34%. Half of 34% is 16%. The area under the curve between 50 and 55 equals 16% minus 2.5% = 13.5%.
Incorrect. First, find the area under the curve less than 50. 100% – 95% = 5%. And half of 5% is 2.5%. Second, find the area under the curve less than 55. 100% – 68% = 34%. Half of 34% is 16%. The area under the curve between 50 and 55 equals 16% minus 2.5% = 13.5%.
2
Try again.
Question 1.10

Chapter 3 Normal Curve image
7HPtN6JQyse4TTbZYSj5qWmo07Zb53nmDYB/pUbg1IT0ntJp4sEqgZqTvhH+1e2vflyvGsd2fCuzbgQQr28CzM6SQRtTrUkmjURZLFW9SBugDfYahhdBQ/nJlI94n5L9zsk3KapboUx6l7EPXehwJQ==
Correct. The area between 55 and 65 is 68%; the area between 65 and 70 is 13.5%: 68% + 13.5% = 81.5%. If you want to know how to get the area between 65 and 70, first, find the area under the curve greater than 70. 100% – 95% = 5%. And half of 5% is 2.5%. Second, find the area under the curve greater than 65. 100% – 68% = 34%. Half of 34% is 16%. Thus, the area under the curve between 65 and 70 equals 16% minus 2.5% = 13.5%.
Incorrect. The area between 55 and 65 is 68%; the area between 65 and 70 is 13.5%: 68% + 13.5% = 81.5%. If you want to know how to get the area between 65 and 70, first, find the area under the curve greater than 70. 100% – 95% = 5%. And half of 5% is 2.5%. Second, find the area under the curve greater than 65. 100% – 68% = 34%. Half of 34% is 16%. Thus, the area under the curve between 65 and 70 equals 16% minus 2.5% = 13.5%.
2
Try again.

Question 1.11

Chapter 3 SAT Math Normal Curve image
ocvt9vq0VkgwlHLYi2PduzWp3uxaDXWYaPHK5T3gWZp8IcDqy3OA2lDtG6pvd8sRzm+2r9uL+tZ7fZFKY092qe2yjfXm0Q3/TNSzVvX7N9/mhmfWzqRhkX2xYJCzTbMdB14ySuF64eVfHKZxcxcnCwEs8ps9ri/zobuu/f0b0BzstVsyOz6r1ZJEXdMhF3Iq9zhO/Zs0pMtBfc/ZcQJCHLFnb8+QWVtRUXkR3JZjY/Pp53on8b48PQ2YohqGWuxF+aaFkZxSTIOn50UuxxUV1K4CGWSXjRF2PkdGXHO6W1Xju+sugj+h3OyocO1AknnJvcy1XqNInUGxWRT7mZO7H7o5hPE=
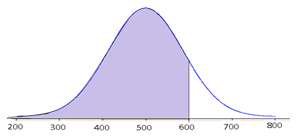
Correct. You actually don’t need to know the values of μ and σ to answer this question. (Note that 400 is one standard deviation below the mean.) The area under the curve within one standard deviation of the mean is 68%. Half of this is 34%. Then note that 50% of the area under the curve is less than the mean. The area less than one standard deviation below the mean is 50% minus 34% = 16%.
Incorrect. You actually don’t need to know the values of μ and σ to answer this question. (Note that 400 is one standard deviation below the mean.) The area under the curve within one standard deviation of the mean is 68%. Half of this is 34%. Then note that 50% of the area under the curve is less than the mean. The area less than one standard deviation below the mean is 50% minus 34% = 16%.
2
Try again.