StatTutor Lesson - Using the Standard Normal Table
true
Stat Tutor
true
true
You have completed 0 question sequences out of 7.
Question 1
43
Question 1.
True or false: Areas given by the Standard Normal Table are cumulative proportions.
| A. |
| B. |
Incorrect. This is a correct statement.
Correct. This is a correct statement.
Incorrect. Try again.
2
Questions 2-3
112
Question 2.
What part of a z-score is given by the values in the top row of a Standard Normal curve?
| A. |
| B. |
| C. |
Incorrect. The top row gives the hundreths digit for a z-score.
Correct. The top row gives the hundreths digit for a z-score.
Incorrect. Try again.
2
Question 4
140
Question 4.
True or false: You can only use the Standard Normal table to find cumulative proportions.
| A. |
| B. |
Incorrect. You can use the Standard Normal table in two ways: (1) to find a cumulative proportion for a z-score and (2) to find a z-score for a cumulative proportion
Correct. You can use the Standard Normal table in two ways: (1) to find a cumulative proportion for a z-score and (2) to find a z-score for a cumulative proportion
Incorrect. Try again.
2
Question 5
171
Question 5.
True or false: The Standard Normal table gives both areas to the right and areas to the left.
| A. |
| B. |
Incorrect. The Standard Normal table gives only cumulative areas which are areas to the left.
Correct. The Standard Normal table gives only cumulative areas which are areas to the left.
Incorrect. Try again.
2
Questions 6-8
397
Question 6.
To find area on the right for a z-score using the Standard Normal table, what should one do?
| A. |
| B. |
| C. |
Incorrect. The Standard Normal table gives cumulative area or area on the left. To find area on the right, first look up the z-score to get the cumulative area and then subtract the cumulative area from 1.0.
Correct. The Standard Normal table gives cumulative area or area on the left. To find area on the right, first look up the z-score to get the cumulative area and then subtract the cumulative area from 1.0.
Incorrect. Try again.
2
Questions 9-11
439
Question 9.
Why is drawing the Normal curve and shading the desired area important?
| A. |
| B. |
| C. |
Incorrect. Drawing the Normal curve and shading the desired area helps one to know how to find the desired area. In addition, often drawing the curve and shading the area gives one a good idea of the approximate answer.
Correct. Drawing the Normal curve and shading the desired area helps one to know how to find the desired area. In addition, often drawing the curve and shading the area gives one a good idea of the approximate answer.
Incorrect. Try again.
2
Applet
552
Applet
646
Applet
755
Questions 12-16
793
Question 12.
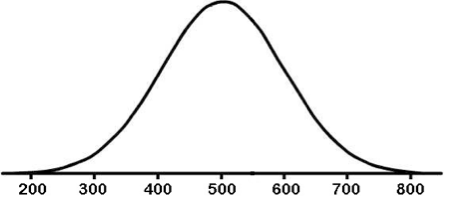
Math SAT scores are Normally distributed with mean µ = 500 and standard deviation σ = 100. Which curve has a shaded area for the proportion of students who score greater than 550 on the SAT Math test?
| A. |
| B. |
| C. |
| D. |
Incorrect. Since we want the area greater than 550, we shade the area under the curve greater than 550.
Correct. Since we want the area greater than 550, we shade the area under the curve greater than 550.
Incorrect. Try again.
2
