StatTutor Lesson - Measuring linear association: correlation
Question 1
Question 1.
Which scattterplot displays data with the strongest relationship?
| A. |
| B. |
| C. |
Question 2
Question 2.
Which scattterplot displays data with the strongest relationship?
| A. |
| B. |
| C. |
Question 3
Question 3.
Which scatterplot displays data with the strongest relationship?
| A. |
| B. |
| C. |
Question 4
Question 4.
On the basis of this formula, what type of variables are required for X and Y?
| A. |
| B. |
| C. |
Question 5
Question 5.
Why is plotting the data so important before computing r?
| A. |
| B. |
| C. |
Question 6
Question 6.
True or false: The formula for computing r includes z-scores for both X and Y.
| A. |
| B. |
Question 7
Question 7.
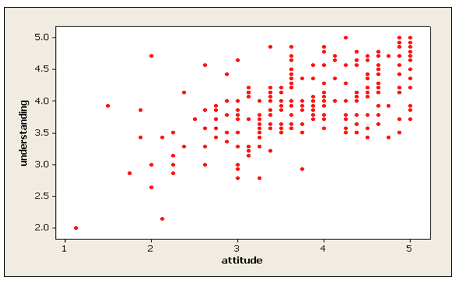
Is the direction of the relationship displayed in the scatterplot positive or negative or no relationship?
| A. |
| B. |
| C. |
Question 8
Question 8.
True or false: Multiplying the z-score for X by the z-score for Y always gives positive products.
| A. |
| B. |
Question 9
Question 9.
True or false: Because the value for r is negative, we can say that the direction of the relationship is negative.
| A. |
| B. |
Question 10
Question 10.
Since r = –0.54, how should we describe the strength of the relationship?
| A. |
| B. |
| C. |
Question 11
Question 11.
True or false: For these data, all of the products are positive.
| A. |
| B. |
Question 12
Question 12.
How would you describe these products?
| A. |
| B. |
| C. |
| D. |
| E. |
Question 13
Question 13.
How would you describe these products?
| A. |
| B. |
| C. |
| D. |
| E. |
Question 14
Question 14.
How would you describe these products?
| A. |
| B. |
| C. |
| D. |
| E. |
Question 15
Question 15.
How would you describe these products?
| A. |
| B. |
| C. |
| D. |
| E. |
Question 16
Question 16.
True or false: The closer the data points are to the line, the closer r is to either –1.0 or +1.0.
| A. |
| B. |
Questions 17-18
Question 17.
With r = 0.941, is direction positive or negative?
| A. |
| B. |
Questions 19-20
Question 19.
With r = –0.553, is direction positive or negative?
| A. |
| B. |
Question 21
Question 21.
With r = –0.226, is direction positive or negative?
| A. |
| B. |
Questions 22-23
Question 22.
With r = –0.226, how should we describe strength?
| A. |
| B. |
| C. |
