Chapter 1. Residuals
true
Stat Tutor
true
true

Question 1
0:51
Question 1.1
1ljVDTmGkjbfwWjhTGRlxoGIHc49YuSiCOdFOemaIh0v5HisJFHDFPqIlOD7zwU6HvPn9FtLyHER82c+kM2IkNR3BCxprPhydqVuzeCJM5eJRyNqIj/NR2bCc6NGoShOVOF3xpgC3kBig79najEeK3iry0JIekNwwk+Kfuf22NFElSXZra/tRI10UokvO/bqiOvuzZBOEy0=Correct. Since the data points do not all lie on the regression line, we have prediction errors.
Incorrect. Since the data points do not all lie on the regression line, we have prediction errors.
2
Try again.
Questions 2-6
1:38
Question 1.2
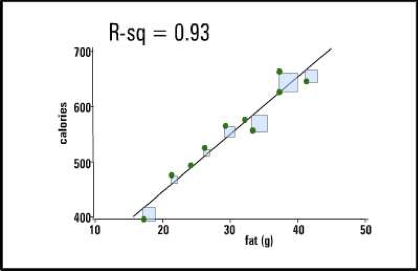
hPxyZisH2VbQ0oRAvTHfJAYW4n3MOeRNon6kUT4Kaz0qhZA/Sn4wNm9p2pYoKyabD/hTFZEfLE9PyZuHjMbHevAGQcRKqW3HiJR9i+/X4yJS857NXCmeQGH781B+8326v3VwHbowUKC1N1RaAELat+yNxu/gNTbjssBpRnjYAf4Y4x5rZgiWMevjGpvTvaKSc5W1vT0tOew96gNTF1cO+UCENn7DRtYp22umvQza/smP+cAqg4Bh4GXE7BE0ONPinmu3k0vDTlTb27Wp+OybkDTwCnrZGL26RHFCE6/k3RygnqqleNRLHtboy8h969WLCorrect. Residual is defined as the vertical distance a data point is from the regression line.
Incorrect. Residual is defined as the vertical distance a data point is from the regression line.
2
Try again.
Question 1.3
1rkEYpMuLqLq7OycC4/FrJ5r7Udok2FPglzcbyZRn7GTaluKQkCUkmmHayrlnKrdPfwTRg/WtMZiSevMdZVHKYI90ezAofTx4f7ZSOrN24bgnbY2Correct. This is a correct statement.
Incorrect. This is a correct statement.
2
Try again.
Question 1.4
nTA4mTwrIF5Jt12LOE/EzViPS2a7ytaX8s+0FiUW3rtf1YhdCYip3vcLFWHFR+hj6lLvT7/KAbu0vxuRqaJjaeeb0GV31Ym/2JL1aS6zQEVV6/iCWKEKSsXS56yMSYSs+A4/WYRYh+ZprQ9abebdagG/BS13WblU74NTezLFrFhvL/kxnEaRw1uTHoeB/UPtcgKxwdn7fRnpZpFzsYfZ18Rsm1dqgr/e+AInuDEAi68zCe5sOd6NG45lzQ8wTvefCorrect. residual = y - \( \widehat{y} \)
Incorrect. residual = y - \( \widehat{y} \)
2
Try again.
Question 1.5
/igCleOO1nUF2I1QsQoF+hr0mLZL6bmSw830d3HMphvmRsPKcmyYx3xNXAoKE5KcjESMXp0ihf7QZq3oaxEBv1n39BydcemRYumGVgNuNxSJ8tQWsKnJ88RrOZituCts9VCxIY+qTBIbnBuWYlLha2eEo38=Correct. If a data point lies below the regression line, residual = y - \( \widehat{y} \) subtracts a smaller y value from a larger \( \widehat{y} \) value, giving a negative residual.
Incorrect. If a data point lies below the regression line, residual = y - \( \widehat{y} \) subtracts a smaller y value from a larger \( \widehat{y} \) value, giving a negative residual.
2
Try again.
Question 1.6

Correct. Since each square is a squared residual, the sum of these squares is the sum of squared residuals.
Incorrect. Since each square is a squared residual, the sum of these squares is the sum of squared residuals.
2
Try again.
Question 7
2:18
Question 1.7
fTcXcluwshKd7aRKdaPWWQ+oVtNP3hvMTHw476SE5JUjWwQGt0qnJYvHCS5+qf/GcKELGWB+J/rp7g18DTQxSGeUhz/osMTgMbOOfiXHDOoayi9F70kg93TmUBetcA0bl+yWCnCp6cVyl32+btHb/e4I5UB7yVfaK88ywUKcnFuEdAW/qR/7YW6wcVFzZ3+ICorrect. This is a correct description of what a residual plot is.
Incorrect. This is a correct description of what a residual plot is.
2
Try again.
Question 8
3:25
Question 1.8
D/EOzvQJG3WHAKotP6l/DjlpHFSGpW8OGxXlriOvrZ+Nj62l4udEyP/VoK5Neg/BokcQ7cMJo08/TNaV6syjiLiMbQAI3D6PeFVYHr5ZTj4nmsTOPjRFI5uqfwcqsGIzpqy3neEAOQFz/QRNF4BxJg==Correct. When the pattern of points in a residual plot forms a shoebox, we know there are no problems with the conditions.
Incorrect. When the pattern of points in a residual plot forms a shoebox, we know there are no problems with the conditions.
2
Try again.
Questions 9-10
4:40
Question 1.9
njgD/5nzrgzh+oww246P5B426eTjYwI9BWKXSy9XibFrpqk0d08fey5KTnK0NrlAbCjsUoidX0p9SDWtMuTmPB7J9UCqajB2Xw+joDLG4uDt2GpcasKofAeeNAbV5cUasGp3Q69bwe6I1xsE35zyzyMYo+E4GFHpY9Kbft/91mr5IQ+UhgT1FHyiD3C88jWOcez0wbf+K10=Correct. A residual plot is just a diagnostic tool for finding problems with the conditions.
Incorrect.A residual plot is just a diagnostic tool for finding problems with the conditions.
2
Try again.
Question 1.10
+faGrb3yRQIFBOYBRzNweWWKTKA5naUVxIJnRJ6FUPsCDAL5Gi3fOloodH5C7hWBqwLftas7JBHxl2f224kStIADD9xIoQ9jhMdTGZTyd/13Kf3Sr2J1N0DIfxE6SfCbhzxhzYT1OZRDzIW+jpQry9D4A1zDhrxYmUVlF0Ypr8iD59TJ9rKf59I0l0IfLV+toA+66rehtEY=Correct. When the pattern in a residual plot is a smile or a frown, the relationship between X and Y is not linear.
Incorrect. When the pattern in a residual plot is a smile or a frown, the relationship between X and Y is not linear.
2
Try again.
Question 11
6:50
Question 1.11
1eRYJEKDbjTwI2KmndWjVDTzBRmxW3bgB+nZoAWhqRhk0DgGEHOKKqxvBZKdcivOUFKvbk3MGSKFtmnukWXQXGY+eU1eQ9d/3CVfWXUZJc3ZzIMHAOVw+xIS9vVhQQ6N/s9LjZgOoU/WTK8lwruDlYqPnsY=Correct. Since sample means and sample standard deviations are used to find slope and y-intercept and they are all affected by outliers, slope and y-intercept are also affected by outliers.
Incorrect. Since sample means and sample standard deviations are used to find slope and y-intercept and they are all affected by outliers, slope and y-intercept are also affected by outliers.
2
Try again.
Applet
7:04
