StatTutor Lesson - Time Plots
true
Stat Tutor
true
true
You have completed 0 question sequences out of 4.
Question 1
41
Question 1.
Which of the following is time series data?
| A. |
| B. |
| C. |
Incorrect. Time series data are data collected over time. The only data sets collected over time are the daily prices of diesel fuel.
Correct. Time series data are data collected over time. The only data sets collected over time are the daily prices of diesel fuel.
Incorrect. Try again.
2
Question 2
83
Question 2.
Which variable is always plotted on the X-axis in a time plot?
| A. |
| B. |
Incorrect. Time is always plotted on the X-axis in a time plot.
Correct. Time is always plotted on the X-axis in a time plot.
Incorrect. Try again.
2
Question 3
148
Question 3.
Which gives more information - histogram or time plot?
| A. |
| B. |
Incorrect. A time plot gives both information about the values of the variable and information about how the variable changes over time.
Correct. A time plot gives both information about the values of the variable and information about how the variable changes over time.
Incorrect. Try again.
2
Questions 4-6
287
Question 4.
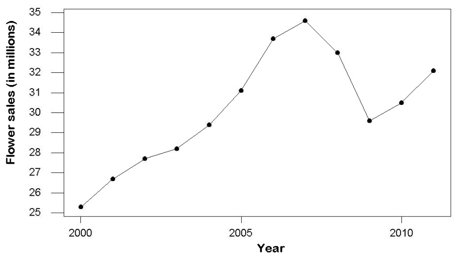
What overall trend is displayed in the following time plot of floral sales in the United States for the years 2000 to 2011?
| A. |
| B. |
| C. |
Incorrect. Overall flower sales increased over time so the trend is upward.
Correct. Overall flower sales increased over time so the trend is upward.
Incorrect. Try again.
2