Chapter 1. Using the Standard Normal Table
true
Stat Tutor
true
true

Question 1
0:43
Question 1.1
zVTeKseTuzPa274aXNdhHo7zPVIMOjPdCiqRu1O1B0FfdaFx/jKoP38RekFdrEr+KQzZhzpbl6tgPAobNa/0uTAOS4jwpYiZ8B73un++ljr8WaiRdz+YCdjAc546tXpNUtNtNhS59HveCm0NIncorrect. This is a correct statement.
Correct. This is a correct statement.
Incorrect. Try again.
2
Questions 2-3
1:52
Question 1.2
q+fFOaVNQWNhpJ2tfPD1Yz4s+FVYC/V+XZt0RwFW9wRpiMIh2QKCYVqn9HxVWf9TDpOlPBgANX+QgsgRQIMFCobD7PVzdF7vj4FMxNuNcRoijggVcdbenrLrQsfn3mssfi2lbXuoAUyfY8NfrEUeDHsFkCxvy91uIZxp9VLcI+Br+FM4sPG05YcI017GLBTJ6fqAqTGaH1vzh6pPIncorrect. The top row gives the hundreths digit for a z-score.
Correct. The top row gives the hundreths digit for a z-score.
Incorrect. Try again.
2
Question 1.3
2PN3eRYPfzSnKuF8xgx9kFnj8+R8gfAMtTZcdXAIhU2FjyxRP690n13/L11DFqO4vOQFa6b0FarvUErrJ/TtCSXgfL29nmXAxAEnRvoNCWdl2uMGkwAWd3zwf6sFnLgMqkzAH9YFsIKprNFTlGkaztQqGMYAJMCaOpFKArN27GliA/smnAz7ZipZ86r8xx/yI/VfpGRoVJ+J7qSJ5UVF/jZxN+RFNpk8yDj+yAuD0EqfPdnEGYFgFZx+d4s=Incorrect. The left hand column of the Standard Normal table gives the ones and tenths digits of a z-score.
Correct. The left hand column of the Standard Normal table gives the ones and tenths digits of a z-score.
Incorrect. Try again.
2
Question 4
2:20
Question 1.4
F60kzVwcNPI7XmmNBaQaFTOPSfFxgKVJVUEPWr2rNV8Kuzbsa4EJnJJ+tGPH7n9cKuV9yADvqJ+CPUv0VdixtGS6A6VOYAQXIl8Ikv1ZGaW9m6HYXJtN2iOQs9BtC9b3XSMIFbqh/oYhRIwb6hmr2g==Incorrect. You can use the Standard Normal table in two ways: (1) to find a cumulative proportion for a z-score and (2) to find a z-score for a cumulative proportion
Correct. You can use the Standard Normal table in two ways: (1) to find a cumulative proportion for a z-score and (2) to find a z-score for a cumulative proportion
Incorrect. Try again.
2
Question 5
2:51
Question 1.5
oaNiUluKrsPaWWM18psSrCPtN9YXmVpqhuY1Y5krnNNpFA3fwnKLdEMDzfXZIBWvanUtoOqDa4gErPRWkKNz+X6VFzbUTr0ExnC1sre4pN1qmKv1yHlAmQ2ECQsVGMzJAev6eQ6OpIA7/1gVd2qCDz8vR2Y=Incorrect. The Standard Normal table gives only cumulative areas which are areas to the left.
Correct. The Standard Normal table gives only cumulative areas which are areas to the left.
Incorrect. Try again.
2
Questions 6-8
6:37
Question 1.6
XnrhyoYhtgRJfTGIaWKmwDaD31bmZySz0WHQWOsmPONCdeFJbeQVgiNqydoC63+AbzOPjjmVh7GCpNbNFpNwI9KslrXgFWdJ7cYyJjzbpCvhs+TppGEtxyH1xnID5TuwUcVVJzqaE55hpAZ0oOAdhogTwz2LazGxuug3/yc/4xQQj7JfxjvYocrZCBNfaFzUQ1JjFhjd5/F5nQVxuGLyGpRzuXBQidjD29r38FfKrKAFShmT5rY1r6cH6BH6rLw3Yv/YSvDy0f3X5xzxBOOVrAFIxd+jBm1wIXf/ze49N2qLIykUW0qIqOwMNfjcqCmGnTk3MEdpMM265OWIuXGqaDcxQFX7a7VAKXfNzLwBcrdlXRAYJjROmmS7vVsZhBbO9smn/yGduqA=Incorrect. The Standard Normal table gives cumulative area or area on the left. To find area on the right, first look up the z-score to get the cumulative area and then subtract the cumulative area from 1.0.
Correct. The Standard Normal table gives cumulative area or area on the left. To find area on the right, first look up the z-score to get the cumulative area and then subtract the cumulative area from 1.0.
Incorrect. Try again.
2
Question 1.7
1ElAPU0R+Lxwwst8kqql5Ae9iIoW7sYUs92ulyUWJt7ZKMFU+a0/IJXtEWq9J0/mF+clBgBMvNzcV9ONXcdLwybM/nn3OZ3nghmSNndINgEJeHwtwIJjlJMqPvo9DaNnDKVT5Oxv8oZEhjCkroLCTaxYVw2ecfLvvxnUEtnG02ZuYrBe0m3bhY6IGP7G/Y376/7cTSVH90tFbjfh1CRO/WjEYrxtBd3/ZWC3Z9bflKHSLTSiBVI0GQpwqpizDsqndgoAFP7JOJBQBapoJEjokQNh+gBXM1RIrRiPjysdva7RAoRI3BJn1wHsFOXiM4EbzE84HPHR+eofRk29t4XZkuWwkPw7YC7C/YMWa+e7Wlg6Qu1oyEsaJhC9QuN6YyZNyEnPhFnXscY=Incorrect. The Standard Normal table gives cumulative areas or areas to the left. So just look up the z-score to find area on the left.
Correct. The Standard Normal table gives cumulative areas or areas to the left. So just look up the z-score to find area on the left.
Incorrect. Try again.
2
Question 1.8
r/HTA0YUsn4JX11fOT1icwKSMvNuIbaIBNwUgqz7cS8redOdqcaRZryaGLchF0SsLoi8b9jSfqu5hyOWsSCmIVZZbt49UXUL8uxVa8hq5w800auldItmi2wduA0inFCig7YjWc31f7GQsgkTNcFVwg9Ubx6xCt2mxaN8GXr4O9wum/GysnOlL/61ZDWFdAGtpKSQ6fe9TY4ga20VHVXe7AI64psIQHb8dUChFJrZrGt/5mz7Q6KZJFWXJOCqhjY/Dz50x8hpOxJkXL73YLxl6/EO16DroNwdab6pyWnnW5CA/0jKfkSghXqt9hyrbWPNiH91WGaWj5Xuz/i2XdJAbjtUmKc3FNSddNvQgDg/QaRPYJ4RzcvN9pCdi2AIL15dIncorrect. To find area between two z-scores, find both cumulative areas and subtract the smallest from the largest.
Correct. To find area between two z-scores, find both cumulative areas and subtract the smallest from the largest.
Incorrect. Try again.
2
Questions 9-11
7:19
Question 1.9
Owmc3yZ2b0PyUCYqzuKhdLPNsqFuBWtgtWWyXoV8kIVckSBQQkcZ4IK46Kc0CguDxMvz4ah+Jb1hzKPm8JBZ7YJewzKK2AeMsR/HK1I+JFr3H1RE9zSiAciwsCeI8LXukMZJfrVH31bDXJL5HvJuR49rnZCjnyePO9w49fRtugkU1g3W9uUItl4Bs4+MCRacipuMANgQXX7+9pwU0x0CTKHW5EBF0OePbIw0eHj7BP53eGZlFPa1n/dshgptePlf/WJDSyenF764g2NCQFIS9Jn+2eg2AVLDkqLug2ipwLBNjs9ibx4Jx6gq/9kUEx3mCnZ4fvJ+jwhnrTzOM8ZqQ1n5m7c66/beMyXVNYHvwYy9K+5lIncorrect. Drawing the Normal curve and shading the desired area helps one to know how to find the desired area. In addition, often drawing the curve and shading the area gives one a good idea of the approximate answer.
Correct. Drawing the Normal curve and shading the desired area helps one to know how to find the desired area. In addition, often drawing the curve and shading the area gives one a good idea of the approximate answer.
Incorrect. Try again.
2
Question 1.10
fNL1ckkt8IgfxPNCb2UaTUX5Iq8QobFaPOqZsMHNTDWiUIJDqCLcASYV3Si8R1FuZUNOMX1Q5PvGcVF2HE9xon5lJDfR16LvZtSidCWZxwhxrcqCmOccRodLZUsdd4gcO0japhTFE+O6BbS3VZRD/MWsGJn8EhvjSZNNqK61CXvsAQQlV7e1Y00uxTrXZUBl2qGSLJ55oTwoO0aig9b2VJdNKf28lnBj6q0tuzIK4BbqoUDydjZ6/2AR/aI=Incorrect. z-scores are given in the left column and across the top margin of the Standard Normal table.
Correct. z-scores are given in the left column and across the top margin of the Standard Normal table.
Incorrect. Try again.
2
Question 1.11
sctIRQRnrygpNwSorYIS3Pq8CDTxihfpRoau8hMOBFb5SzLkl41sKeF0JFH+gDQ72V7KNqeeWWSzaTabKBsUDwx3AobFcIy8+WLpqCvaw0tbIwOchltMcmya+haspm2z+s8bTuC4vrPNmgeLP9IkO8tbz5Ork58rUs9L2XVm48nXGh1zUmh95GJichsOcF5Pj2E1keIsNallZ00Zw2hGdZoZMaoo/ZIUlr0cXgF2HHavrjKGoKghKvEp/cG0nf20n7RIbTTHyXs=Incorrect. Cumlative areas (proportions) are given in the inside of the Standard Normal table.
Correct. Cumlative areas (proportions) are given in the inside of the Standard Normal table.
Incorrect. Try again.
2
Applet
9:12

Applet
10:46

Applet
12:35

Questions 12-16
13:13
Question 1.12
+Kxb91ND1vRC4KlZEXL+CfvUGpE9D4RyuJFavxejK4U3O3HA+/7KlWbw47P//2ZW6D+FA32RgMWRwlO4s+R6ukS1vU71LpbyXBcu+2SdiHQ4MfgCUMYa1SaknHW21PXExtZPqR+hCRVLeYMKo5Fo87XaF5aJrcCGLhB3Bgaz6tsQRAAZZS3rahXkADNW/15akahob/87WWxavNQxQiwvwNPMpXnkh0hwqQZKNiX9So44dq/Zool3YHFSgYJK4e6aCjApygwpmjjVrjMP989VKLYKjE1SKyl+EmeZ++v/iFaRzQJBJNmus70MCazWVIYPYLnYvYvGCFoXHglaKMk/3DAOFKHy0/VuGAUriWt7+B3EAvh4h4k47XZD2psKqtQAgit89VFYSrWwszKCfW4I2MC1g18bF7gEocxa1YhhrRGkzphUMOfPMtwsXr+TkYcwKTKR4jjPX2lzM+z30EZAIrMUE9+ai77g5STfLX1xfDkryAteWX2LP3JZZIssApbHGlNa6Ly9CTFJbbz6SdPjUYEWvQ4WP7N7lsggW55pMc2ICmJPRWEW4CZl9lPGJdUTlZAP31j+amc1Yvxp/rbLc/+fuIIOM2FeNjR6OySexdMj9VKhGxqvpPrvCs9ln5ho3yDudqEvD8Y6B1Jm2g5pZvpEcP7+cQnyWjS/z52Dawos6w8aTRp+KG1QPDoJ8wxq1k6Un1HnaXbdIimm1epsylD7Y/0q8v/hxR6aMWEq/8o1wOo0k80on1Plo1/TVbxj3ajFrgS8YG8n6t7E04SiHZgCFJHtUOFlch2Inmzz97FI5GuEvMT108b/xWHT0BLNFDDLfA3/9uWyvfTQt6ixzAQ2BfxaggX7WmcuyRienm9EYcgvsx16rNr+KTjIl5tMEndqsOSohJ6FD+9RQsoFbGkAHb+KMqIr4uiOVx0AH8SXkx3UGpJyfTKP2c117UW+JPCzLYRFZrzhKwIRXb9ar2Sucupx27IUTrS9UWebRJuMPd25UNRVd6SBS/38fqt5b/n7L7VZF18TSJ1VezibPYdITlLcqY5L7KPvBanYbu1qZ7y6jUvvfJK2QGyBkPfi8mFczHOj43hCMiUoB7fFrcqk0kH76TgVVblj/hL8hFvfk7BYkyIkmI5VUPaoZCW3dmmLzoEh2LOkVbC3BIP6Bv3KxXiJhuKkdSSCRO+BAmbNszJMt068rJyymffySGpGD0Gxfe9qB6/JiPr23xpNdA==Incorrect. Since we want the area greater than 550, we shade the area under the curve greater than 550.
Correct. Since we want the area greater than 550, we shade the area under the curve greater than 550.
Incorrect. Try again.
2
Question 1.13
lI7Ss/x33vwvZR5CMyBMHU9C83ojVlbAHOgkqUjgjsTVxbZCsMIFPwDuZ2o4rgggg3fJFTSh0cgD6dghOSefl3lXzf3gi1ACuusWMZD7rPr2DTf2TdIxApAOuTmyNDbY4WpZZtw/m4ACfuhIJ/NcjuZ0H5HS1LvfH23RrPSExvrpNkV7SeffS2a126n//gQDkcSOiXo9PWOMd9vp13Xb5r5dLV7QTwdR2XH6UZTHnfTMZDqestYsxAw5FteIIepn6MaFsFpIrnCZJ5TuzKM+zKAxY3MFufk7WqPS+FoVqVQIzQAcsFVRel49Nz7feZlpa9PrVkLv2xleHaNi6HQReSRT6Wa2GyQ0k09+X2BEkQNO5Gqt2tFipHCCvZFeYSdhfuYv4hPGD1vXE53yuNnU97WinY0K2tJB2Y7002EZasAU+G+j8cCymD2jyJ9stcuhs2zjBaXzZ88hHZdToeb0YS0eBBvMfazSrt1GqmjB3r+BqJwFJ7rMqev9C8xtCAakqbt8AEMPYnGfbeiMqhpoWE1o26ZGPJb7HRA/5gvMyAN1jrHfNsfON4LqckAgfYOmw9itcX+ETicgdBszOC/SvC7sYjcyEBcgyKdV/bv6cDeRU8Z7+MB4NrcDGlfKcjmYjfokVswvKGDu36me7d+Lxe69yHtupnWIRQr6XATaqx/bEwpf+5KqIt1CB1OScLyCa4ad63Y79KTlwTqoMxwGIgOvdaAxYaeSY6mSeKMLa6KbP52E6GvD/9/wuZdaVM30rN0R73mOYJAa3bZy8FHGdsqBKgDWe2hgb+ervvq/C9O2syxZEcRn2kdMJOVO2uyNh/iPpODxS4/b/GdMTijcnRxDQlp3bV4QFCWE9b6D4NjuNtN9DjMhRXYI1Uz2pdk5YAGEFfHnKPMZVSqfOAzGGmwteJPzL1VWGa7N3727GKxYL28Dxq7ewNXUTPv7Zah+NquaCe0BDLWFYOtQWDhWfLk1mZW6Q1VLdAFJ3H/X0hf/sZZLMdQge2Mhb3BrfJz4tJCDL0ke2ti5zl6NlYJNpCGK/dr7MaiKAmj2kyzgavacel/rctnOzNJ7VzTXr0LQmPP/Xk0blRKr2JRHies4EQk3Elkfk5OUW382qsYyWMfIYWgGjUiiIcuiNTad4MX0WAsIk+C31kKGJvUwPRH4wUVzI4ymvSN5/DpdSf14WjTHI5R5y9RYGAFN6s4vHZxR5pQ7o2t7OlWhEq8sTU9V5Q==Incorrect. Since we want the area less than 450, we shade that area under the Normal curve.
Correct. Since we want the area less than 450, we shade that area under the Normal curve.
Incorrect. Try again.
2
Question 1.14

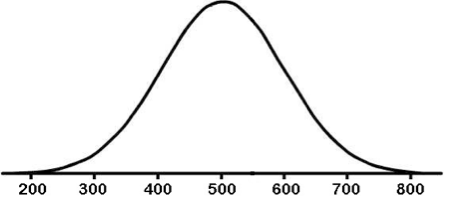
Incorrect. Half of the curve or 50% is greater than the mean, µ = 500. 68% of the area is between 400 and 600. Half of 68% is 34% so 34% of the area is greater than 600. So the area greater than 550 has to be between 50% and 16%.
Correct. Half of the curve or 50% is greater than the mean, µ = 500. 68% of the area is between 400 and 600. Half of 68% is 34% so 34% of the area is greater than 600. So the area greater than 550 has to be between 50% and 16%.
Incorrect. Try again.
2
Question 1.15

Incorrect. 50% of the area is less than the mean, µ = 500. 84% of the area is less than one standard deviation above the mean, i.e., 84% is less than 600. And 2.5% is greater than 700 or, in other words, 97.5% is less than 700. So the area less than 650 must be between 84% and 97.5%.
Correct. 50% of the area is less than the mean, µ = 500. 84% of the area is less than one standard deviation above the mean, i.e., 84% is less than 600. And 2.5% is greater than 700 or, in other words, 97.5% is less than 700. So the area less than 650 must be between 84% and 97.5%.
Incorrect. Try again.
2
Question 1.16

Incorrect. 16% of the area is less than 400 and 2.5% is less than 300. So, the area is between 16% and 2.5%. Further, it should be less than 13.5% since 13.5% of the area is between 300 and 400.
Correct. 16% of the area is less than 400 and 2.5% is less than 300. So, the area is between 16% and 2.5%. Further, it should be less than 13.5% since 13.5% of the area is between 300 and 400.
Incorrect. Try again.
2