Chapter 1. Normal Distributions

true
Stat Tutor
true
true

Question 1

1:02

Question 1.1

0rQio30+1f77q6hLRdK33+KEJqwmqY2iAVaHg+BVEQbtLcn9Uc1z5zIC0thFHoKYGNakm823ESobvCPHnkcq2T43vq2YKaBrY1ZFP9kInNM57FW015mCcryquazYRNo8JV6WwC8aZ5LwaTstV2HlYn8mMaP3Eqkw8OGvghNmTEsYEkUsfESXPrUPTflgJl2L6QgWUSoR9RW9aRmPkRJtdy+LRlY1IQ1Vd27XKXnu6gcUa/LkskzSBDcg17m6QgclOiFCjqz99CdpKPMRkpIIHFulk2l+MM8I+HSdUg==
Incorrect. Normal density curves model many bell-shaped distributions.
Correct. Normal density curves model many bell-shaped distributions.
Incorrect. Try again.
2

Question 2

1:18

Question 1.2

KkUMbNzsOot2XEWRzOOa3sfkFX4Zn+bYHEWpO/vQ+Zek556LefhGa3au0h9aHVfu1/CofIk+T1bjfR4AU9jikLX0B9xE+hq/ADOrIAUSvnRrSzo8/Eku50+V5TUwPw73ABYXzWqKc6KRrrgmuTpAmVG/A1P4cUzGt0o0dxD2vjxpMKvoPqCELJWzUQY=
Incorrect. A Normal distribution is single peaked.
Correct. A Normal distribution is single peaked.
Incorrect. Try again.
2

Questions 3-8

2:49

Question 1.3

xp9R93diKY7bOul0hE5xXmryIi4pb5jv6suEgosnLMlwtOcKbgUFdHrkqofwVuJ06xHBVvWkOAd9qsGAdP7PU5FQwNrL7N5IQCPs/0Zm9mOpt7pdSVR5PnOjg4vQGWj4
Incorrect. This is a correct statement.
Correct. This is a correct statement.
Incorrect. Try again.
2

Question 1.4

BSwAam1oDnVMkmy4vwmA241IvFK8NhlpkYI2Ig9VgZwTN+iiDLcnv0RyDJ8eopBqr7B0dtnjfRsRymxW4RmyY2U0Xi0R2bzTQbsLk5DBEM40pvZ1QiaYLf1kFGEypyElDPup/o69SdMlkM9PTS4X4wcPZ5lyyEz/xJ3lyjxPkGuRzNco4hECYN7v17On0o4+j2zlAw==
Incorrect. Standard deviation equals the distance from the mean to the point where the curve begins to fall less steeply.
Correct. Standard deviation equals the distance from the mean to the point where the curve begins to fall less steeply.
Incorrect. Try again.
2

Question 1.5

tt19IzWcYqTF+/Y4PaBX6Ludc5CoOFW3ikgbsIRTrbZq3FWb60aHbR8wN/J4r3CiCA7mLlfZFmojesiw//kbv/rtRnq0lzpPa23itpnOzAcKrXdK0YrISi6ofU4jDMJ00+rLrjLnsj0VKExhXdoMy2tHge7UXYbf
Incorrect. There are three arrows on either side of the mean. Each arrow has length equal to σ (standard deviation).
Correct. There are three arrows on either side of the mean. Each arrow has length equal to σ (standard deviation).
Incorrect. Try again.
2

Question 1.6

P6uGnrtcZ5a2nx1Oy1JZwVvy0TdpuOBeJw27MLAjLU2j8hQrwY1w+fseoeruTV+M52ENv0628YzZr0CcMl5MFOrOh5PeXkA2d07sf+LVM1BTBtyNpZRYB1huLJF6nafTnW9IB3s/Xsdg/70vCZc4+q51xE49Mg54dF4oaj93ktSb8Bj8fKD+Yk37o8eAAFuHIh+XMcLoiMLK+K93EdwaeBimL1oS0h77a8TBgyyYHf1OSWNb
Incorrect. µ and σ characterize a Normal distribution.
Correct. µ and σ characterize a Normal distribution.
Incorrect. Try again.
2

Question 1.7

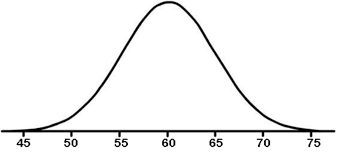
Normal Curve Image
wV/vl9sM6Lb93mbD9ghl7GIjM7nLudXMh8C0+Tsk9IlaO1JSJ9AO/RhRAFfLPn7BQ97oNzzQUTRWy8dUyCvNM0fS1DH5uUyADGOQGDy6ZW0=
Incorrect. The value on the x-axis directly below the highest peak of the curve in the center is 60.
Correct. The value on the x-axis directly below the highest peak of the curve in the center is 60.
Incorrect. Try again.
2

Question 1.8

Normal Curve Image
5Amkci079nQXHm6pBlgRBDPZAq++w/t1eItpUGDqNSyhTVhrCxMfALXrohUCO0DGFKATGE4FU7oIi+GXrsZDAioqh0iRVB76hTT+0iVJ5cHadAG23yR7+7ysww4=
Incorrect. Since there are three standard deviation lengths on either side of the mean, standard deviation equals 5 for this Normal curve. Another way to find this is to first compute range and then divide range by 6. For this Normal curve, range = 75 - 45 = 30 and 30/6 = 5.
Correct. Since there are three standard deviation lengths on either side of the mean, standard deviation equals 5 for this Normal curve. Another way to find this is to first compute range and then divide range by 6. For this Normal curve, range = 75 - 45 = 30 and 30/6 = 5.
Incorrect. Try again.
2

Applet

3:20