| Name | Last modified | Size | Description | |
|---|---|---|---|---|
| Parent Directory | - | |||
| waitingtime.png | 2017-06-29 17:56 | 24K | ||
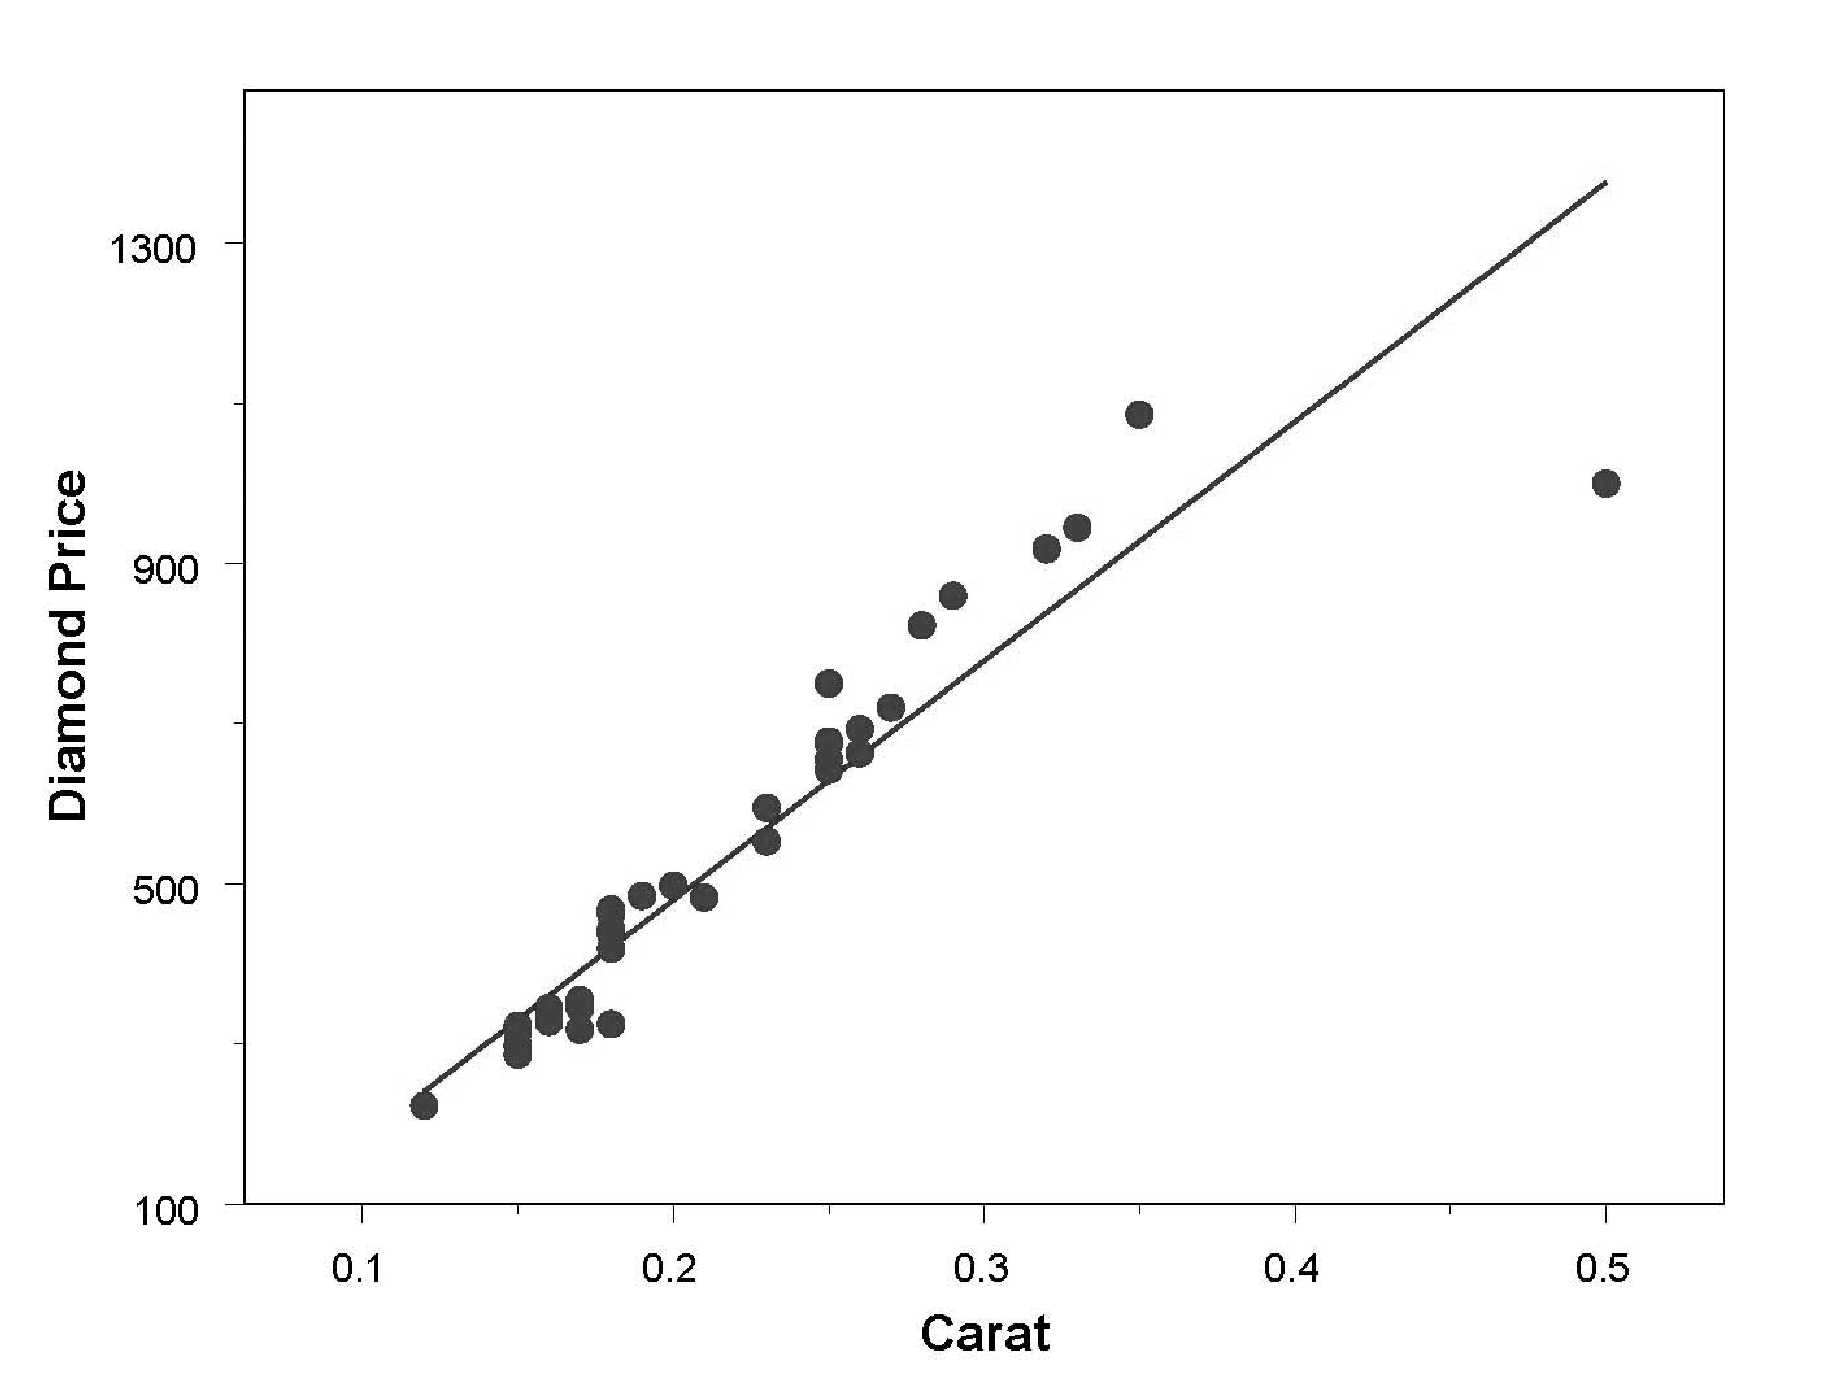
| scatterplot23.png | 2017-06-29 17:56 | 26K | ||
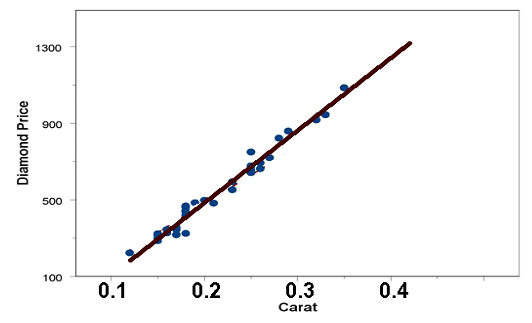
| scatterplot.png | 2017-06-29 17:56 | 34K | ||
| residuals_scatterplot.png | 2017-06-29 17:56 | 36K | ||
| randomsurvey.png | 2017-06-29 17:56 | 10K | ||
| q10.png | 2017-06-29 17:56 | 23K | ||
| q9.png | 2017-06-29 17:56 | 17K | ||
| q8.png | 2017-06-29 17:56 | 23K | ||
| q7.png | 2017-06-29 17:56 | 23K | ||
| q6.png | 2017-06-29 17:56 | 16K | ||
| q5.png | 2017-06-29 17:56 | 17K | ||
| q4.png | 2017-06-29 17:56 | 23K | ||
| q3.png | 2017-06-29 17:56 | 23K | ||
| q2.png | 2017-06-29 17:56 | 18K | ||
| q1.png | 2017-06-29 17:56 | 18K | ||
| n689599-7.png | 2017-06-29 17:56 | 20K | ||
| motorvehiclesprobability.png | 2017-06-29 17:56 | 11K | ||
| motorvehicles.png | 2017-06-29 17:56 | 11K | ||
| marginaltable.png | 2017-06-29 17:56 | 10K | ||
| images/ | 2017-06-29 17:55 | - | ||
| genderstatus.png | 2017-06-29 17:56 | 13K | ||
| dist30.png | 2017-06-29 17:56 | 7.3K | ||
| collegemajors.png | 2017-06-29 17:56 | 11K | ||
| collegemajorprobabilitydistributions.png | 2017-06-29 17:56 | 11K | ||
| ch20_shape_of_sampling_distribution.swf | 2017-06-29 17:56 | 201K | ||
| ch20_sample_size_calculator.swf | 2017-06-29 17:56 | 76K | ||
| ch16_relationship_between_power_beta_effectsize.swf | 2017-06-29 17:56 | 171K | ||
| ch16_relationship_between_alpha_and_power.swf | 2017-06-29 17:56 | 96K | ||
| ch14_margin_of_error_calculator.swf | 2017-06-29 17:56 | 81K | ||
| ch10_run_simulations.swf | 2017-06-29 17:56 | 11K | ||
| ch10_pick_door.swf | 2017-06-29 17:56 | 763K | ||
| ch8-tablenumbers.png | 2017-06-29 17:56 | 7.9K | ||
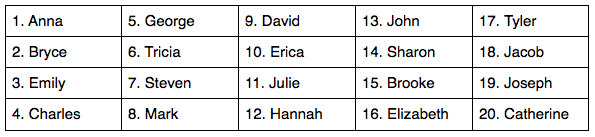
| ch8-tablenames.png | 2017-06-29 17:56 | 22K | ||
| ch5_least_squares.swf | 2017-06-29 17:56 | 22K | ||
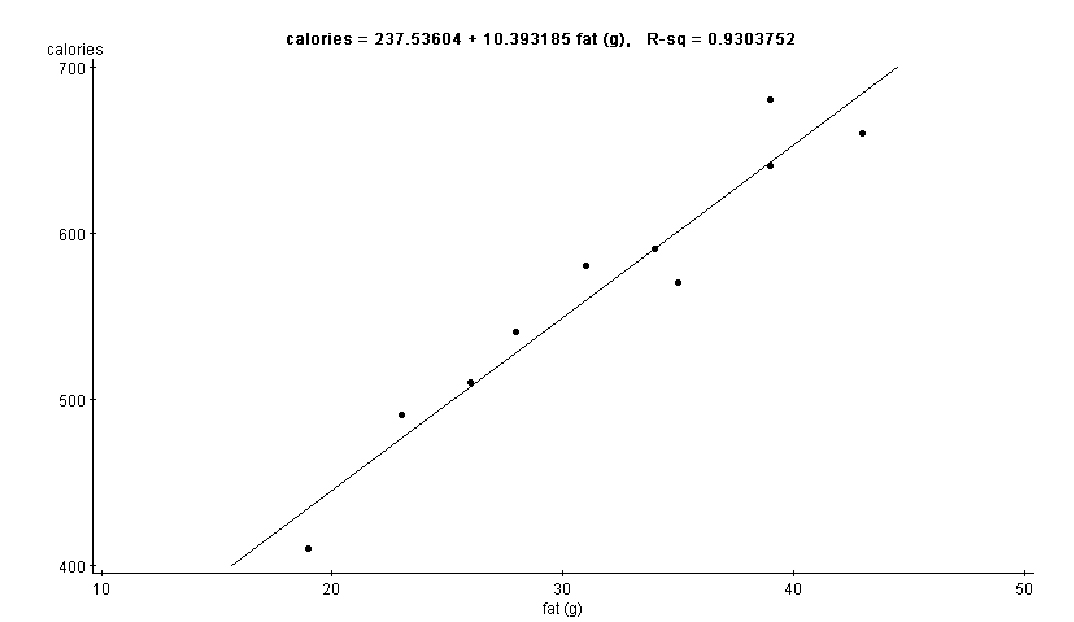
| ch5-leastsquare12.jpg | 2017-06-29 17:56 | 52K | ||
| ch5-cautions8.jpg | 2017-06-29 17:56 | 40K | ||
| ch5-cautions5.jpg | 2017-06-29 17:56 | 181K | ||
| ch3_standardization_applet.swf | 2017-06-29 17:56 | 19K | ||
| ch3_satscores.png | 2017-06-29 17:56 | 11K | ||
| ch3_comparing_mean_and_median_by_dragging_the_yellow_triangle.swf | 2017-06-29 17:56 | 144K | ||
| ch3_changing_mu_and_sigma_for_normal_distributions.swf | 2017-06-29 17:56 | 7.9K | ||
| ch3_689599-7.png | 2017-06-29 17:56 | 20K | ||
| ch3-table1.png | 2017-06-29 17:56 | 19K | ||
| ch3-graph500.png | 2017-06-29 17:56 | 23K | ||
| ch3-graph4.png | 2017-06-29 17:56 | 24K | ||
| ch3-graph3.png | 2017-06-29 17:56 | 26K | ||
| ch3-graph2.png | 2017-06-29 17:56 | 25K | ||
| ch3-graph1.png | 2017-06-29 17:56 | 23K | ||
| ch3-4.png | 2017-06-29 17:56 | 8.3K | ||
| ch3-1.png | 2017-06-29 17:56 | 13K | ||
| ch2_standard_deviation.swf | 2017-06-29 17:56 | 21K | ||
| ch2_how_mean_balances_data.swf | 2017-06-29 17:56 | 117K | ||
| ch2_how_mean_and_median_compare.swf | 2017-06-29 17:56 | 90K | ||
| ch1_time_plots_q4.png | 2017-06-29 17:56 | 26K | ||
| ch1_effect_of_interval_size_on_histograms.swf | 2017-06-29 17:56 | 77K | ||
| ch-3-3.png | 2017-06-29 17:56 | 14K | ||