Chapter 1. Tutorial 1.2: Creating and interpreting bar charts and pie charts
Problem Statement
{0.30, 0.35, 0.40, 0.45, 0.50}
rand(0,4)
0.45[3]
{a,b,d}
rand(0,2)
b[1]
{0,2,0}
2[1]
{10,10,10}
10[1]
{a,b,c,d}
rand(0,3)
b[1]
{3,6,7,5}
6[1]
{6,7,5,3}
7[1]
{7,5,3,6}
5[1]
{5,3,6,7}
3[1]
{2.5,6,7,4}
6[1]
{6,7,4,2.5}
7[1]
{7,4,2.5,6}
4[1]
{4,2.5,6,7}
2.5[1]
{left,right,right,left}
right[1]
{right,left,left,right}
left[1]
{a,b,c,d}
b[1]
{c,d,a,b}
d[1]
{3,6,7,5}
6[1]
{6,7,4,2.5}
7[1]
{to the right of,to the left of,to the left of,to the right of}
to the left of[1]
Consider the following density curves.
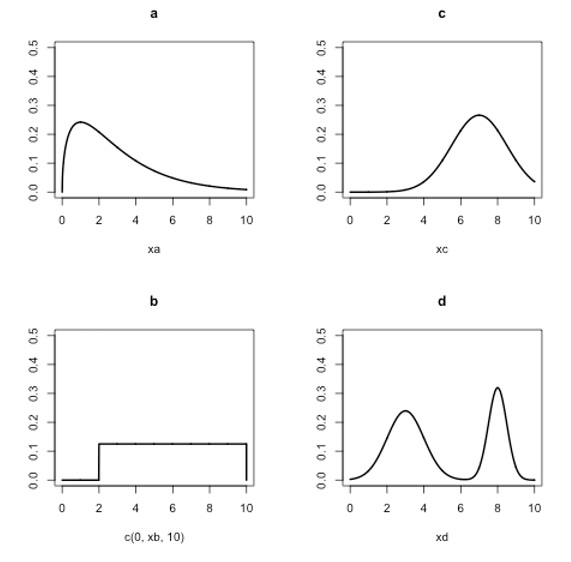
Figure 1.1
Step 1
questions
Question 1
A density curve has a total probability (total area under the curve) of ___.
Correct.
Incorrect.
Step 2
Question 4
Distribution (a):
| A. |
| B. |
| C. |
| D. |
Correct.
Incorrect.
Step 3
Question 8
The approximate mean of the distribution labeled as b above is:
| A. |
| B. |
| C. |
| D. |
Correct.
Incorrect.