Chapter 1. Tutorial: Regression 2
Problem Statement
Consider the plot of the number of drownings in a state vs. the total ice cream sales for the state over a 15 year period.
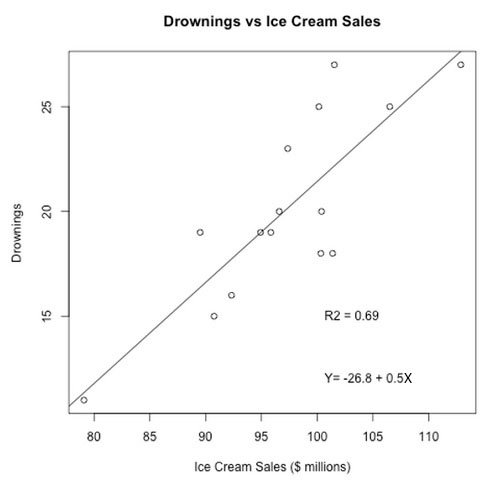
Figure 1.1: Figure Caption
Step 1
questions
Question 1
The indicates that for every additional million dollars of sales of ice creams, the expected number of drownings increases by .
Correct.
Incorrect.
Step 2
Consider the following plots of a relationship between X and Y.
Figure 1.2
You might be surprised to learn that the R2 = 0.666 for ALL of the above plots!
For each of the below explanations, select the appropriate set:
Question 4
R2 is not appropriate because the relationship is not linear.
| A. |
| B. |
| C. |
| D. |
Correct.
Incorrect.