Chapter 1. Tutorial 27.2: Statistical Process Control – Xbar charts
Problem Statement
Consider a process to manufacture computer monitors. An important quality variable is the color rendition of the input signal which is measured using a colorimeter. From long experience, the mean calorimeter reading when the process is in control is 63 (from a scale of 0 to 100) with a standard deviation of individual measurements of 10. During the manufacturing process, a technician takes a sample of 4 monitors every shift and measures the color rendition.
Step 1
questions
Question 1
The process mean is ____.
Step 2
Question 4
The upper control limit of the Xbar control chart is (round your answer to two decimal places) ____ .
Step 3
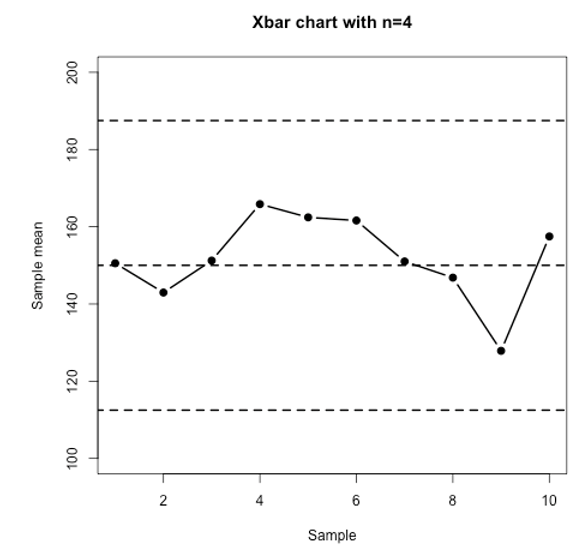
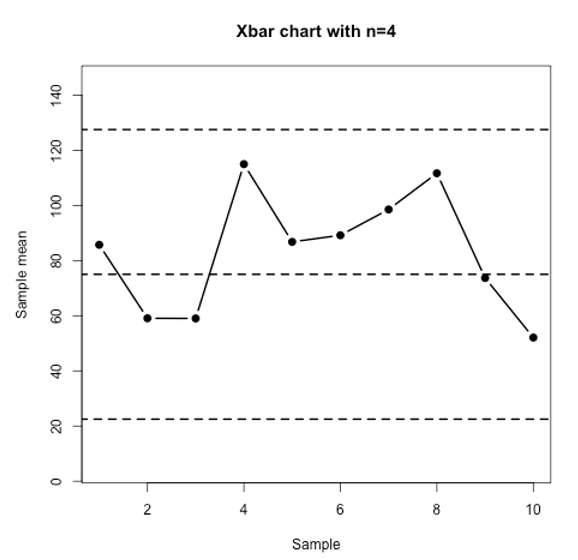
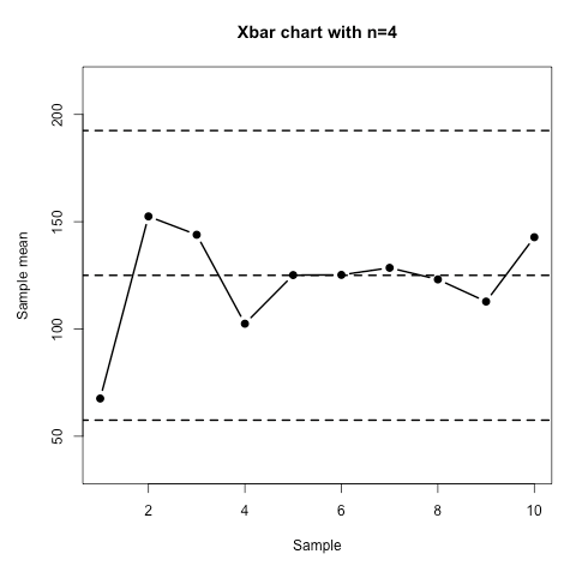
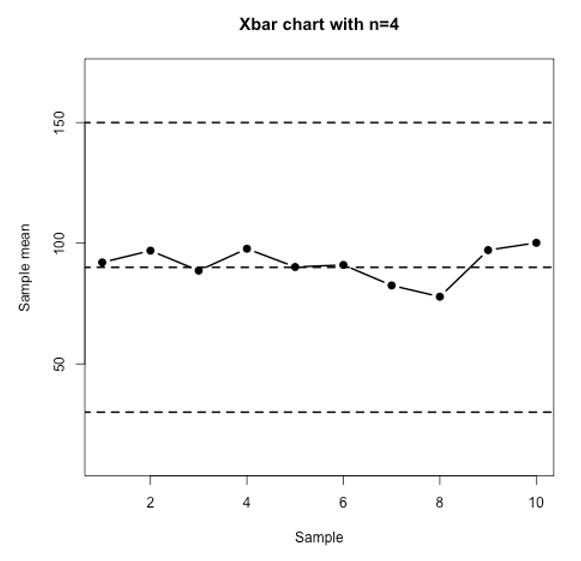
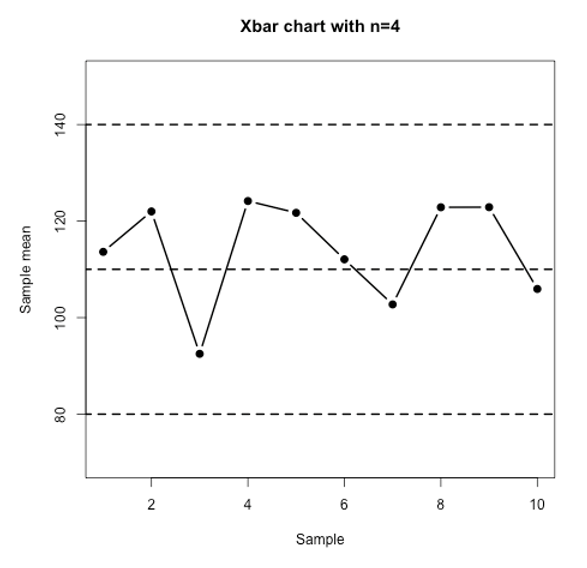
Consider the following Xbar control charts and answer the following questions:
Question 7
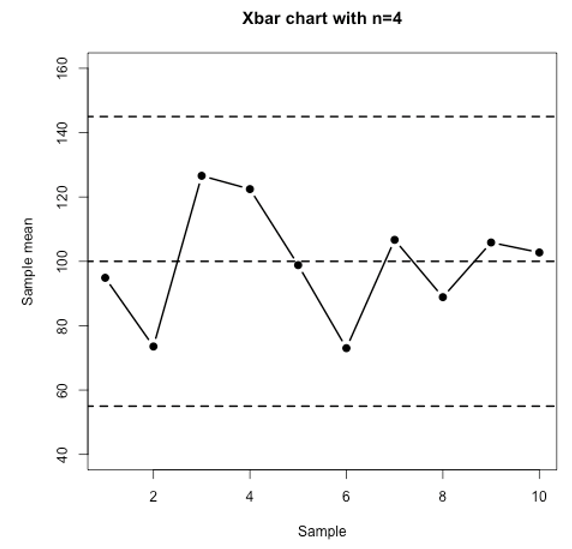
The mean when the process is in control is . The standard deviation of the INDIVIDUAL observations when the process is in control is .
