Chapter 1. Tutorial 1.3: Creating and interpreting stemplots and histograms
Problem Statement
The data set below shows the height in inches of each of the players on the Chicago Bulls roster for the 2012-2013 season.
| Heights of Chicago Bulls players, in inches | ||||||||||||||||
|---|---|---|---|---|---|---|---|---|---|---|---|---|---|---|---|---|
| 75 | 77 | 81 | 79 | 81 | 77 | 96 | 81 | 79 | 76 | 79 | 82 | 83 | 82 | 69 | 75 | 74 |
Use stemplots and histograms to examine the distribution of the players' heights.
Step 1
questions
Question 1
First we will create a stemplot for the heights. This will require the following four values for the stems: .
Step 2
questions
Question 6
Next we want to create a stemplot for the heights with split stems, so that there are two rows for each stem. Give the value of the leaf for each of the following heights, and tell in which row the leaf should be placed (first or second row of the stem).
The value 70 would have leaf and would be placed in the row of the 7 stem.
The value 82 has leaf and should be placed in the row of the 8 stem.
The value 75 has leaf and should be placed in the row of the 7 stem.
The value 69 has leaf and should be placed in the row of the 6 stem.
The value 78 would have leaf and would be placed in the row of the 7 stem.
Step 3
Question 9
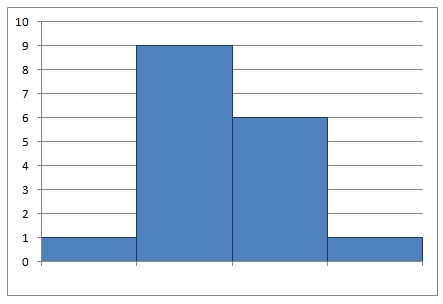
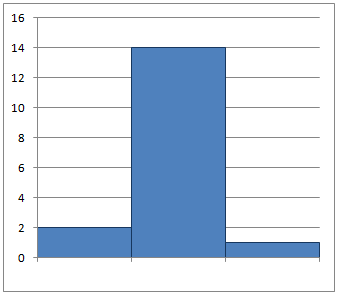
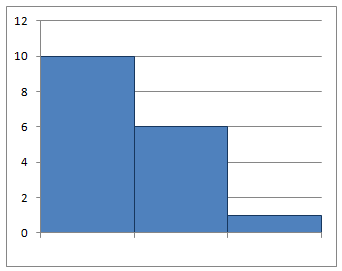
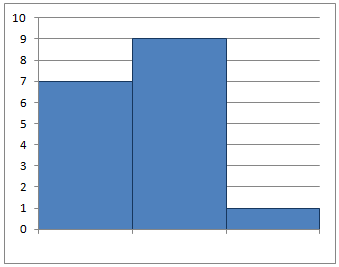
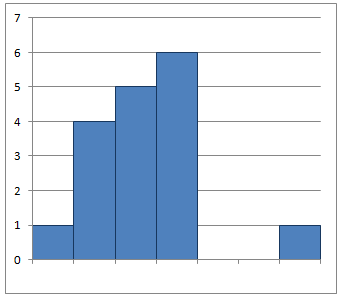
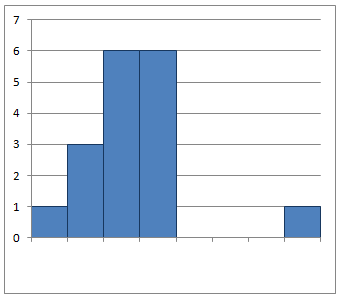
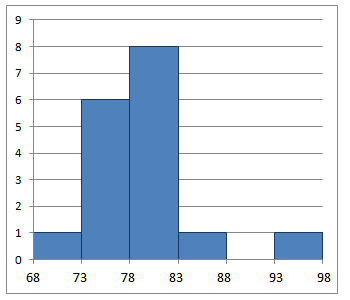
Now we are interested in constructing a histogram of the height data. The stemplots can be viewed as “rough drafts” of two possible histograms. Fill in the blanks with the appropriate values:
The stemplot with split stems corresponds to a histogram with bin size , and the original histogram without split stems corresponds to a histogram with bin size .