Chapter 1. Tutorial: Measures of Spread
1.1 Problem Statement
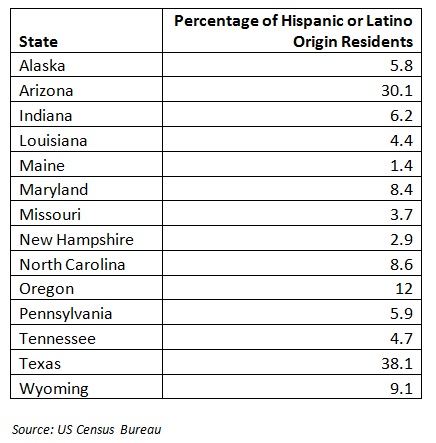
The data set below shows 14 randomly selected states and the percentage of each state’s residents who are of Hispanic or Latino origin. Describe the measures of spread for this data set.

1.2 Step 1
questions
Question 1.1
Compute the 5-number summary for the data set.
Min: ztLboxgeblo= Q1: tsyGNzGSEfA= Median: ZGrVgxWUIl0= Q3: 7rfG+lqaJmI= Max: lBTygAO5oCo=
Question 1.2
OelNDhj1Xkv9BmvVYCkyp5bHt2l14LLAyMKDK2IevWg3XV3g4D0AZUR9VTqp4KLMLxOCg9X+U16s7BBU+FuQce7K89M=Question 1.3
tPM5nWrEm0izyBq9GuqUGEX0ejkm2zY6Knvg5YiVsqRlvLD0H62eCfpGZTK15kuPjO8N4SruH6bNjQowtnB2Ow==1.3 Step 2
questions
Question 1.4
IYLuKiyFKb3cYUe6pzLhOBVr5OZeOYtfXtP4e02Vg2t61OIcMOpsg7C0ZaPBXJkLmfgzOaEbd/8Ec+ALuy5ugFm7H3o=Question 1.5
Use the 1.5 IQR rule to identify the boundaries for outliers in this data set.
Bound for low outliers: ZLKCJr9WK44ubUPd
Bound for high outliers: JxCwOnFs788xWljU
Question 1.6
The following states are from the data set. The outliers are acCHcdlH7+T1AVRcn594QLCvEA/3NdKROEl+28B2xPkm0q+pJLadKcUdIHLaRqjhujOTOw== and XlQCkQt+m7RnyfUBmMvUB1FS7e+XNLUbc3JoZOy2em41tok0Q+HQU64uxv/RpF0dN1w9ZO6vmpI=
1.4 Step 3
questions
Question 1.7
Recompute the 5-number summary with outliers omitted from the data set.
Min: ztLboxgeblo= Q1: RFjLlqfq3ng= Median: scWP7+m3LKA= Q3: 9yO04YIDdB0= Max: DDH6Tw1RFEk=
Question 1.8
With outliers omitted, the range of the data set (max – min) is vX53lGU0amI= and the IQR is qdtJubbGyOI=
Question 1.9
2kO5l8eRdVHnlhvydZYyB8l4jXCQP12q1j/IcDxLDfgiaB7fp1FVGRm4IP7yJ+XKpGpJi+z8RIXtm8YzxusRmRpWTO/0W6AQMPdMo6DUgXV41/opTgeS2b4qcVo=Question 1.10
The following measures of spread that are strongly influenced by outliers are RC7jg99ZTpRltSAia3NBYQ== and li95b0QEaPUdc1s220ckRFeqJSkLllGulEJPSg==