Chapter 1. Tutorial: Scatterplots
Problem Statement
A dataset consists of the composition of 77 breakfast cereals - a portion of the dataset is shown below.

Figure 1.1: Calories - calories/serving; Protein, Fat, Fiber, Total Carbohydrates, Sugars - grams/serving.
Calories – calories / serving; Protein, Fat, Fiber, Total Carbohyrates, Sugars – grams/serving
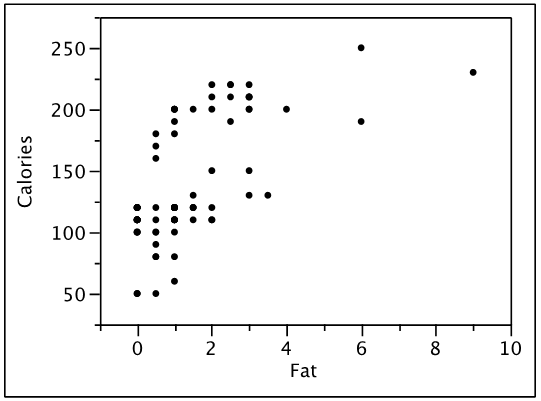
Here is plot of the relationship between the calories/serving and the number of grams of fat.

Step 1
questions
Question 1
The is the explanatory variable and the is the response variable.
Correct.
Incorrect.
Step 2
questions
Question 4
There appears to be between the calories/serving and the grams of fat/serving.
Correct.
Incorrect.
Step 3
questions
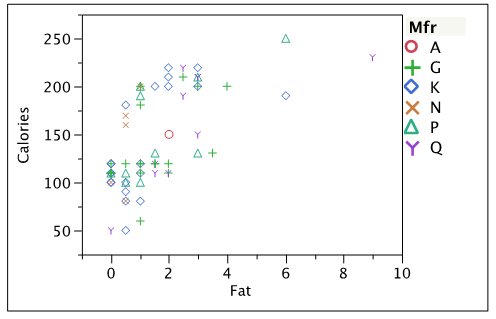
A scatterplot of the number of calories/serving and the grams of fat/serving uses a different symbol for each manufacturer:

Question 6
Manufacturer A only had one cereal in the set. This cereal has grams of fat and calories/serving.
Correct.
Incorrect.