Chapter 1. Tutorial 1.2: Creating and interpreting bar charts and pie charts
Problem Statement
{40, 50, 60, 70}
rand(0,3)
50[1]
{40, 20, 30, 10}
rand(0,3)
20[1]
{20, 30, 10, 20}
rand(0,3)
30[1]
{15, 20, 25, 30}
rand (0,3)
20[rand (0,3)]
{60, 65, 70, 75}
65[rand (0,3)]
{70, 75, 80, 85}
75[rand (0,3)]
50/100*20/100
20/100
50/100
20/100*65/100
30/100*75/100
0.1+0.13+0.225
0.225/0.455/100
75/100
0.13/0.455
0.225/0.455
65/100
65/100
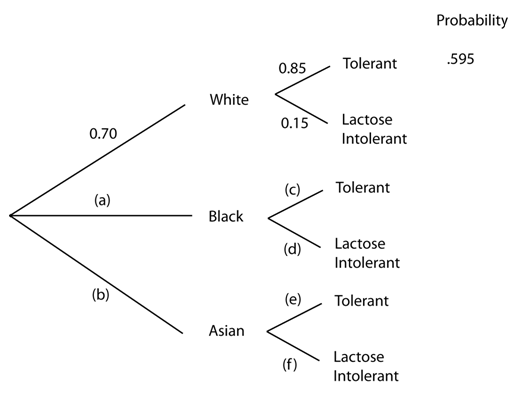
Lactose intolerance causes difficulty digesting dairy products that contain lactose (milk sugar). It is particularly common among people of African or Asian ancestry. At a college 50 % of the population is white; 20 % is black; and 30 % is Asian. Moreover, 20 % of whites, 65 % of blacks, and 75 % of Asians are lactose intolerant.
Consider the (partially) completed tree diagram below:

Step 1
questions
Question 1
The probability that a randomly chosen student is white and lactose intolerant is
Correct.
Incorrect.
Step 2
questions
Question 4
The probability that a random chosen student is black and lactose intolerant is _____
Correct.
Incorrect.
Step 3
questions
Question 7
What fraction of lactose intolerant students are Asian?
Correct.
Incorrect.