Chapter 1. Tutorial 1.2: Creating and interpreting bar charts and pie charts
Problem Statement
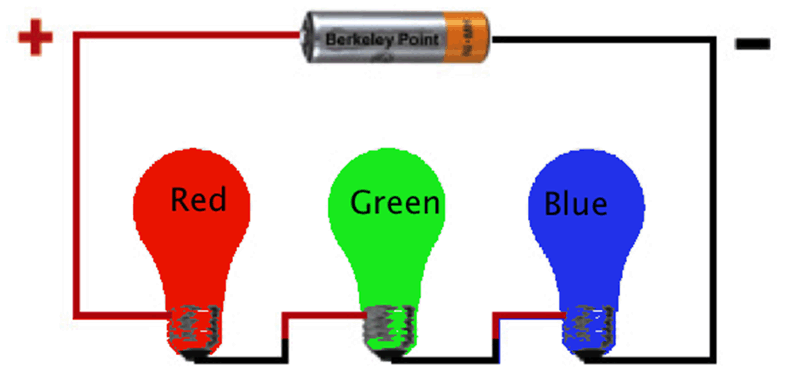
Series circuits have the components on the same line and if any one fails, the entire circuit does not work (similar to old fashion Christmas lights). Consider the series circuit below with different colored lights. The probability that a bulb fails during the holiday season varies by color with P(failure for red) = 0.3 ; P(failure for green)=0.60; P(failure for blue) = 0.70. Each bulb fails independently of the other bulbs.

Step 1
questions
Question 1
The probability that the red bulb will last for the entire holiday season is _____.
Step 2
questions
Question 6
A
[ [ ["Delta Air Lines",$DeltaPassengers],["AirTran Airways",$AirTranPassengers], ["Southwest Airlines", $SouthwestPassengers],["American Airlines",$AmericanAirlinesPassengers] , ["US Airways", $UsAirwaysPassengers], ["All Others", $AllOthersPassengers ]]]
B
[ [ ["Delta Air Lines",$DeltaPassengersDiv2],["AirTran Airways",$AirTranPassengersDiv2], ["Southwest Airlines", $SouthwestPassengers],["American Airlines",$AmericanAirlinesPassengers] , ["US Airways", $UsAirwaysPassengers], ["All Others", $AllOthersPassengers ]]]
C
[ [ ["Delta Air Lines",$DeltaPassengers],["AirTran Airways",$AirTranPassengersDiv2], ["Southwest Airlines", $SouthwestPassengers],["American Airlines",$AmericanAirlinesPassengers] , ["US Airways", $UsAirwaysPassengers], ["All Others", $AllOthersPassengersDiv2 ]]]
D
[ [ ["Delta Air Lines",$DeltaPassengers],["AirTran Airways",$AirTranPassengers], ["Southwest Airlines", $SouthwestPassengersMult4],["American Airlines",$AmericanAirlinesPassengersMult4] , ["US Airways", $UsAirwaysPassengersMult4], ["All Others", $AllOthersPassengers ]]]
Which of the following pie charts represents the airline passenger data?
| A. |
| B. |
| C. |
| D. |
| E. |
Step 3
Question 8
A
[ [ ["Delta Air Lines",$DeltaPassengers],["AirTran Airways",$AirTranMult2], ["All Others", $AllOthersMult2]]]
B
[ [ ["Delta Air Lines",$DeltaPassengers],["AirTran Airways",$AirTranPassengersDiv2], ["All Others", $AllOthers2Div2]]]
C
[ [ ["Delta Air Lines",$DeltaPassengers],["AirTran Airways",$AirTranPassengers], ["All Others", $AllOthers2]]]
D
[ [ ["Delta Air Lines",$DeltaPassengers],["AirTran Airways",$AirTranPassengers], ["All Others", $AllOthersPassengers]]]
Suppose we only want to show how the top 2 airlines compare to all others combined. Construct a pie chart with only 3 categories—Delta, AirTran, and All Others. Which of the following pie charts represents the given passenger data correctly?
| A. |
| B. |
| C. |
| D. |