| Table 4.3 Graphics and Their Purposes | ||
| Type of Graphic | Purpose | Example |
|
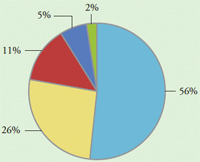
Pie (circle) chart
|
To show the relationships among parts of a whole; to show how given parts of a unit are divided or classified | A chart showing the proportions of different racial and ethnic groups in the U.S. population |
|
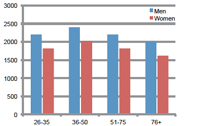
Bar graphs
|
To make comparisons between quantities or amounts | A graph comparing the number of calories needed by men and women leading sedentary lives |
|
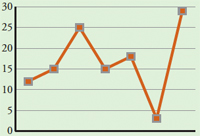
Line graphs
|
To show changes in a variable over time or to compare relationships between two or more variables | A graph showing variations in quiz scores |
|
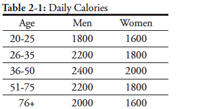
Tables
|
To organize and condense data; to compare and classify information | A table showing how many calories men and women need daily for various age groups with either an active or a sedentary lifestyle |
|
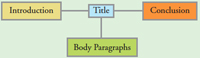
Diagrams and flowcharts
|
To explain processes or procedures or show how things work | A diagram showing the parts of an essay |