EXERCISE 4.19 Working with Tables and Figures
EXERCISE 4.19 Working with Tables and Figures
EXERCISE 4.19
Working with Tables and Figures
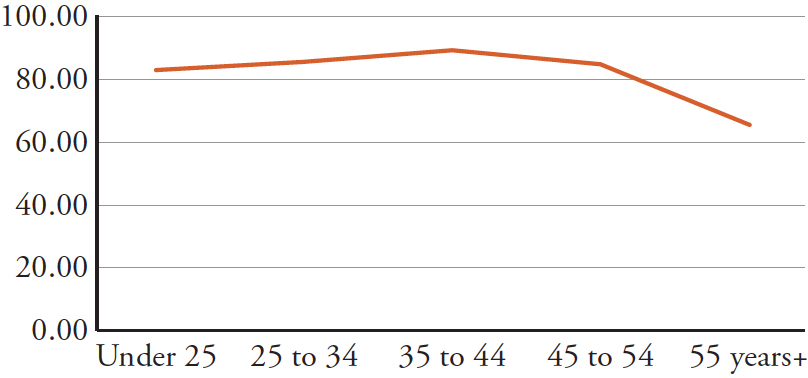
Study the figure below, which converts some of the data from Table 4.5 into a line graph, and answer the following questions.
Question 4.61
1. Compare this figure with Table 4.5. What variables does this figure use? Which data from that table were used to create this figure?
Question 4.62
2. What title would you give this figure? The title should accurately describe the information conveyed by the figure.
Question 4.63
3. Write a caption for this figure that accurately describes the trend(s) it shows.
[Leave] [Close]