5.2 Assess Your Understanding
Concepts and Vocabulary
Question 5.1
Explain how rectangles can be used to approximate the area enclosed by the graph of a function y=f(x)≥0, the x-axis, and the lines x=a and x=b.
Question 5.2
True or False When a closed interval [a,b] is partitioned into n subintervals each of the same length, the length of each subinterval is a+bn.
Question 5.3
If the closed interval [−2,4] is partitioned into 12 subintervals, each of the same length, then the length of each subinterval is _________.
Question 5.4
True or False If the area A under the graph of a function f that is continuous and nonnegative on a closed interval [a,b] is approximated using upper sums Sn, then Sn≥A and A=lim.
9
Skill Building
Question 5.5
Approximate the area A enclosed by the graph of f(x) = \dfrac{1}{2}x+3, the x-axis, and the lines x=2 and x=4 by partitioning the closed interval [2, 4] into four subintervals: \left[ 2, \dfrac{5}{2}\right], \left[ \dfrac{5}{2},3 \right], \left[3, \dfrac{7}{2}\right], \left[ \dfrac{7}{2}, 4\right].
- Using the left endpoint of each subinterval, draw four small rectangles that lie below the graph of f and sum the areas of the four rectangles.
- Using the right endpoint of each subinterval, draw four small rectangles that lie above the graph of f and sum the areas of the four rectangles.
- Compare the answers from parts (a) and (b) to the exact area A=9 and to the estimates obtained in Example 1.
Question 5.6
Approximate the area A enclosed by the graph of f(x) =6-2x, the x-axis, and the lines x=1 and x=3 by partitioning the closed interval [ 1,3] into four subintervals: \left[1, \dfrac{3}{2}\right], \left[ \dfrac{3}{2},2\right], \left[ 2,\dfrac{ 5}{2}\right], \left[ \dfrac{5}{2},3\right].
- Using the right endpoint of each subinterval, draw four small rectangles that lie below the graph of f and sum the areas of the four rectangles.
- Using the left endpoint of each subinterval, draw four small rectangles that lie above the graph of f and sum the areas of the four rectangles.
- Compare the answers from parts (a) and (b) to the exact area A=4.
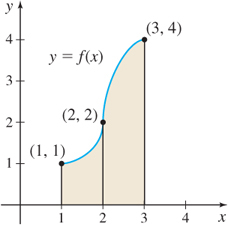
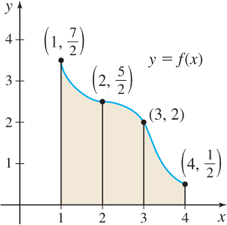
In Problems 7 and 8, refer to the illustrations. Approximate the shaded area under the graph of f from 1 to 3:
- By constructing rectangles using the left endpoint of each subinterval.
- By constructing rectangles using the right endpoint of each subinterval.
Question 5.7
Question 5.8
In Problems 9-12, partition each interval into n subintervals each of the same length.
Question 5.9
[1,4] with n = 3
Question 5.10
[0,9] with n = 9
Question 5.11
[{-}1,4] with n = 10
Question 5.12
[{-}4,4] with n = 16
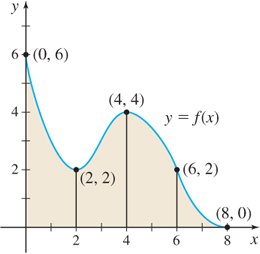
In Problems 13 and 14, refer to the graphs. Approximate the shaded area:
- By using lower sums s_{n} (rectangles that lie below the graph of f).
- By using upper sums S_{n} (rectangles that lie above the graph of f).
Question 5.13
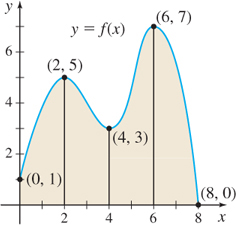
Question 5.14