Approximating the Area Under the Graph of a Function
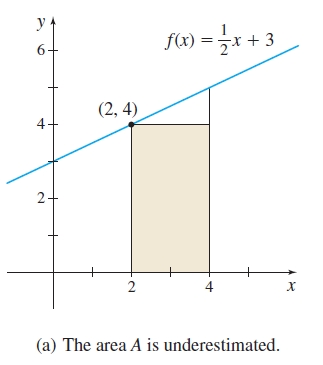
Approximate the area \(A\) enclosed by the graph of \(f(x) =\dfrac{1}{2}x+3,\) the \(x\)-axis, and the lines \(x=2\) and \(x=4\).
We begin by drawing a rectangle of width \(4-2=2\) and height \(f (2)=4.\) The area of the rectangle, \(2\cdot 4=8,\) approximates the area \(A,\) but it underestimates \(A,\) as seen in Figure 5(a).
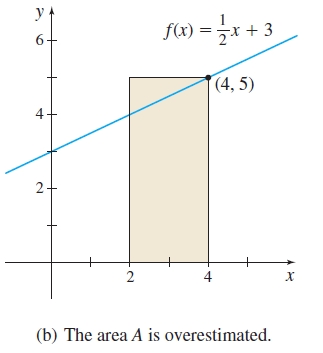
Alternatively, \(A\) can be approximated by a rectangle of width \(4-2=2\) and height \(f (4) =5.\) See Figure 5(b). This approximation of the area equals \(2\cdot 5=10\), but it overestimates \(A.\) We conclude that \[ 8 \lt A \lt 10 \]

345
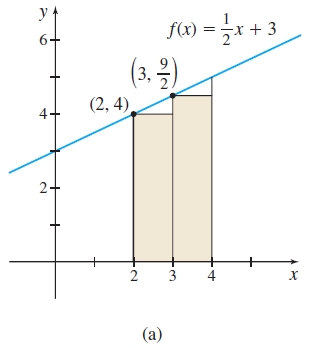
The approximation of the area \(A\) can be improved by dividing the closed interval \([2, 4] \) into two subintervals, \([2, 3] \) and \([3, 4].\) Now we draw two rectangles: one rectangle with width \(3-2=1\) and height \(f(2) =\dfrac{1}{2}\cdot 2+3=4\); the other rectangle with width \(4-3=1\) and height \(f (3) =\dfrac{1}{2} \cdot 3+3=\dfrac{9}{2}.\) As Figure 6(a) illustrates, the sum of the areas of the two rectangles \[ 1\cdot 4+1\cdot \dfrac{9}{2}=\dfrac{17}{2}=8.5 \] underestimates the area.
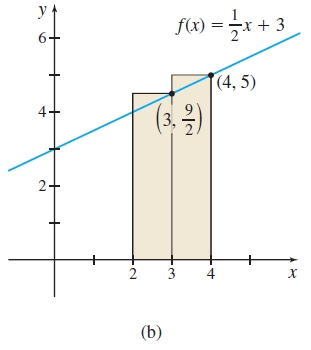
Now we repeat this process by drawing two rectangles,one of width \(1\) and height \(f(3) =\dfrac{9}{2};\) the other of width \(1\) and height \(f(4) =\dfrac{1}{2}\cdot 4+3=5\). As Figure 6(b) illustrates, the sum of the areas of these two rectangles, \[ 1\cdot \dfrac{9}{2}+1\cdot 5=\dfrac{19}{2}=9.5 \]
overestimates the area. We conclude that \[ 8.5\lt A\lt9.5 \]
obtaining a better approximation to the area.
The actual area in Figure 4 is 9 square units, obtained by using the formula for the area \(A\) of a trapezoid with base \(b\) and parallel heights \(h_{1}\) and \(h_{2}\): \[ A = \dfrac{1}{2}b (h_{1} +h_{2}) =\dfrac{1}{2}(2) (4+5) = 9. \]