P.1 Functions and Their Graphs
2
OBJECTIVES
When you finish this section, you should be able to:
- Evaluate a function (p. 3)
- Find the domain of a function (p. 4)
- Identify the graph of a function (p. 5)
- Analyze a piecewise-defined function (p. 7)
- Obtain information from or about the graph of a function (p. 7)
- Use properties of functions (p. 9)
- Find the average rate of change of a function (p. 11)
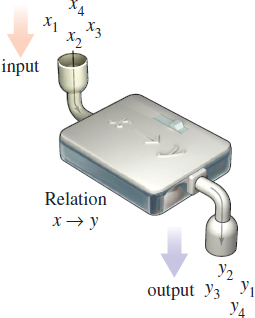
Often there are situations where one variable is somehow linked to another variable. For example, the price of a gallon of gas is linked to the price of a barrel of oil. A person can be associated to her telephone number(s). The volume \(V\) of a sphere depends on its radius \(R\). The force \(F\) exerted by an object corresponds to its acceleration \(a\). These are examples of a relation, a correspondence between two sets called the domain and the range. If \(x\) is an element of the domain and \(y\) is an element of the range, and if a relation exists from \(x\) to \(y\), then we say that \(y\) corresponds to \(x\) or that \(y\) depends on \(x\), and we write \(x\rightarrow y\). It is often helpful to think of \(x\) as the input and \(y\) as the output of the relation. See Figure 1.
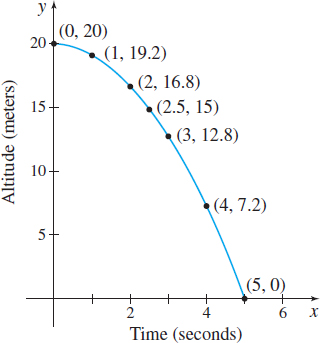
Suppose an astronaut standing on the moon throws a rock 20 meters up and starts a stopwatch as the rock begins to fall back down. If \(x\) represents the number of seconds on the stopwatch and if \(y\) represents the altitude of the rock at that time, then there is a relation between time \(x\) and altitude \(y\). If the altitude of the rock is measured at \(x=1\), \(2\), \(2.5\), \(3\), \(4\), and \(5\) seconds, then the altitude is approximately \(y=19.2\), \(16.8\), \(15\), \(12.8\), \(7.2\), and \(0\) meters, respectively.
| Time, \({ x}\) (in seconds) |
Altitude, \({ y}\) (in meters) |
|---|---|
| 0 | 20 |
| 1 | 19.2 |
| 2 | 16.8 |
| 2.5 | 15 |
| 3 | 12.8 |
| 4 | 7.2 |
| 5 | 0 |
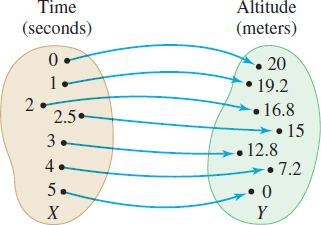
The astronaut could express this relation numerically, graphically, or algebraically. The relation can be expressed by a table of numbers (see Table 1) or by the set of ordered pairs \(\{ ( 0,20) , ( 1,19.2) ,( 2,16.8) ,( 2.5,15) ,( 3,12.8) ,( 4,7.2), ( 5,0) \} ,\) where the first element of each pair denotes the time \(x\) and the second element denotes the altitude \(y\). The relation also can be expressed visually, using either a graph, as in Figure 2, or a map, as in Figure 3. Finally, the relation can be expressed algebraically using the formula \[ y=20-0.8x^{2} \]
NOTE
Not every relation is a function. If any element \(x\) in the set \(X\) corresponds to more than one element \(y\) in the set \(Y\), then the relation is not a function.
In this example, notice that if \(X\) is the set of times from \(0\) to \(5\) seconds and \(Y\) is the set of altitudes from \(0\) to \(20\) meters, then each element of \(X\) corresponds to one and only one element of \(Y\). Each given time value yields a unique, that is, exactly one, altitude value. Any relation with this property is called a function from \(X\) into \(Y\).
3
spanDEFINITIONspan Function
Let \(X\) and \(Y\) be two nonempty sets.* A function \(f\) from \(X\) into \(Y\) is a relation that associates with each element of \(X\) exactly one element of \(Y\).
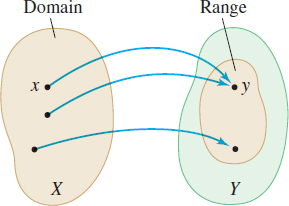
The set \(X\) is called the domain of the function. For each element \( x\) in \(X\), the corresponding element \(y\) in \(Y\) is called the value of the function at \(x\), or the image of \(x\). The set of all the images of the elements in the domain is called the range of the function. Since there may be elements in \(Y\) that are not images of any \(x\) in \(X\), the range of a function is a subset of \(Y\). See Figure 4.
*The sets \(X\) and \(Y\) will usually be sets of real numbers, defining a real function. The two sets could also be sets of complex numbers, defining a complex function, or \(X\) could be a set of real numbers and \(Y\) a set of vectors, defining a vector-valued function. In the broad definition, \(X\) and \(Y\) can be any two sets.
1 Evaluate a Function
Functions are often denoted by letters such as \(f\), \(F\), \(g\), and so on. If \( f\) is a function, then for each element \(x\) in the domain, the corresponding image in the range is denoted by the symbol \(f( x)\), read “\(f\) of \(x\)." \(f( x) \) is called the value of \(f\) at \(x\). The variable \(x\) is called the independent variable or the argument because it can be assigned any element from the domain, while the variable \(y\) is called the dependent variable, because its value depends on \(x.\)
Evaluating a Function
For the function \(f\) defined by \(f(x) =2x^{2}-3x\), find:
- \(f( 5) \)
- \(f( x+h)\)
- \(f( x+h) -f( x) \)
- \(\dfrac{f( x+h) -f( x) }{h}, h\neq 0\)
Solution (a) \(f( 5) =2 ( 5)^{2}-3( 5) =50-15=35\)
(b) The function \(f( x) =2x^{2}-3x\) gives us a rule to follow. To find \(f( x+h) \), expand \(( x+h) ^{2} \), multiply the result by \(2\), and then subtract the product of \(3\) and \(( x+h)\). \[ \begin{eqnarray*} &&f( x+h) = 2( x+h) ^{2}-3( x+h) =2( x^{2}+2hx+h^{2}) -3x-3h\\ &&\,\underset{\color{#0066A7}{\hbox{In}\ f( x)\ \hbox{replace}\ x\ \hbox{by}\ x+h}}{\color{#0066A7}{{\uparrow}}}\\ &&\hspace{5.5pc} =2x^{2}+4hx+2h^{2}-3x-3h \end{eqnarray*} \]
(c) \(f( x+h) -f( x) =[ 2x^{2}+4hx+2h^{2}-3x-3h] -[ 2x^{2}-3x] =\) \(4hx+2h^{2}-3h\)
(d) \[ \begin{eqnarray*} &&\dfrac{f( x+h) -f( x) }{h}= \dfrac{4hx+2h^{2}-3h}{h}=\dfrac{h[ 4x+2h-3] }{h} \underset{\underset{\color{#0066A7}{h \neq 0;\ \hbox{divide out}\ h}}{\color{#0066A7}{\uparrow}}}{=} 4x+2h-3\\ \end{eqnarray*} \]
The expression in (d) is called the difference quotient of \( f\). Difference quotients occur frequently in calculus, as we will see in Chapters 2 and 3.
NOW WORK
Problems 13 and 23.
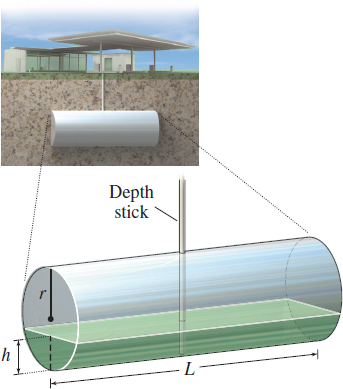
Finding the Amount of Gasoline in a Tank
A Shell station stores its gasoline in an underground tank that is a right circular cylinder lying on its side. The volume \(V\) of gasoline in the tank (in gallons) is given by the formula \[ V( h) =40h^{2}\sqrt{\dfrac{96}{h}-0.608} \] where \(h\) is the height (in inches) of the gasoline as measured on a depth stick. See Figure 5.
4
- If \(h=12\) inches, how many gallons of gasoline are in the tank?
- If \(h=1\) inch, how many gallons of gasoline are in the tank?
Solution (a) We evaluate \(V\) when \(h=12.\) \[ V( 12) =40 ( 12) ^{2} \sqrt{\dfrac{96}{12}-0.608}=40\cdot 144 \sqrt{8-0.608}=5760 \sqrt{7.392}\approx 15{,}660 \]
There are about 15,660 gallons of gasoline in the tank when the height of the gasoline in the tank is 12 inches.
(b) Evaluate \(V\) when \(h=1.\) \[ V( 1) =40 ( 1) ^{2} \sqrt{\dfrac{96}{1}-0.608}=40 \sqrt{96-0.608}=40 \sqrt{95.392}\approx 391 \]
There are about \(391\) gallons of gasoline in the tank when the height of the gasoline in the tank is 1 inch.
Implicit Form of a Function
In general, a function \(f\) defined by an equation in \(x\) and \(y\) is said to be given implicitly. If it is possible to solve the equation for \(y\) in terms of \(x\), then we write \(y=f( x) \) and say the function is given explicitly. For example,
| Implicit Form | Explicit Form |
|---|---|
| \(x^{2}-y=6\) | \(y=f( x) =x^{2}-6\) |
| \(xy=4\) | \(y=g( x) =\dfrac{4}{x}\) |
2 Find the Domain of a Function
In applications, the domain of a function is sometimes specified. For example, we might be interested in the population of a city from 1990 to 2012. The domain of the function is time, in years, and is restricted to the interval \([ 1990,2012]\). Other times the domain is restricted by the context of the function itself. For example, the volume \(V\) of a sphere, given by the function \(V=\dfrac{4}{3}\pi R^{3}\), makes sense only if the radius \(R\) is greater than \(0\). But often the domain of a function \(f\) is not specified; only the formula defining the function is given. In such cases, the domain of \(f\) is the largest set of real numbers for which the value \(f( x) \) is defined and is a real number.
Finding the Domain of a Function
Find the domain of each of the following functions:
- \(f( x) =x^{2}+5x\)
- \(g( x) =\dfrac{ 3x}{x^{2}-4}\)
- \(h( t) = \sqrt{4-3t}\)
- \(F( u) =\dfrac{5u}{\sqrt{u^{2}-1}}\)
NEED TO REVIEW?
Solving inequalities is discussed in Appendix A.1, pp. A-5 to A-8.
Solution (a) Since \(f( x) =x^{2}+5x\) is defined for any real number \(x\), the domain of \(f\) is the set of all real numbers.
(b) Since division by zero is not defined, \(x^{2}-4\) cannot be \( 0,\) that is, \(x\neq -2\) and \(x\neq 2.\) The function \(g( x) = \dfrac{3x}{x^{2}-4}\) is defined for any real number except \(x=-2\) and \(x=2.\) So, the domain of \(g\) is the set of real numbers \(\{ x|x\neq -2, x\neq 2\} \).
(c) Since the square root of a negative number is not a real number, the value of \(4-3t\) must be nonnegative. The solution of the inequality \(4-3t\geq 0\) is \(t\leq \dfrac{4}{3}\), so the domain of \(h\) is the set of real numbers \(\left\{ t |t\leq \dfrac{4}{3}\right\}\) or the interval \(\left( -\infty ,\dfrac{4}{3}\right] \).
(d) Since the square root is in the denominator, the value of \(u^{2}-1\) must be not only nonnegative, it also cannot equal zero. That is, \(u^{2}-1>0.\) The solution of the inequality \(u^{2}-1>0\) is the set of real numbers \(\{ u|u<-1\} \cup \{ u|u>1\} \) or the set \(( -\infty ,-1) \cup ( 1,\infty )\).
5
NEED TO REVIEW?
Interval notation is discussed in Appendix A.1, p. A-5.
If \(x\) is in the domain of a function \(f\), we say that \(f\) is defined at \(x,\) or \(f( x) \) exists. If \(x\) is not in the domain of \(f\), we say that \(f\) is not defined at \(x,\) or \( f( x) \) does not exist. The domain of a function is expressed using inequalities, interval notation, set notation, or words, whichever is most convenient. Notice the various ways the domain was expressed in the solution to Example 3.
NOW WORK
Problem 17.
3 Identify the Graph of a Function
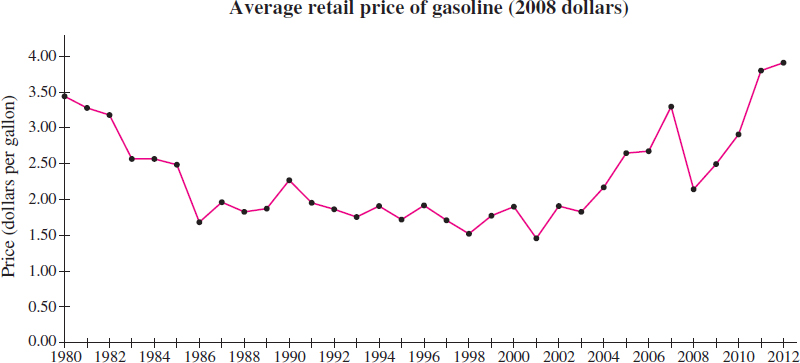
In applications, often a graph reveals the relationship between two variables more clearly than an equation. For example, Table 2 shows the average price of gasoline at a particular gas station in Texas (for the years 1980–2012 adjusted for inflation, based on 2008 dollars). If we plot these data and then connect the points, we obtain Figure 6.
| Year | Price | Year | Price | Year | Price |
|---|---|---|---|---|---|
| 1980 | 3.41 | 1991 | 1.90 | 2002 | 1.86 |
| 1981 | 3.26 | 1992 | 1.82 | 2003 | 1.79 |
| 1982 | 3.15 | 1993 | 1.70 | 2004 | 2.13 |
| 1983 | 2.51 | 1994 | 1.85 | 2005 | 2.60 |
| 1984 | 2.51 | 1995 | 1.68 | 2006 | 2.62 |
| 1985 | 2.46 | 1996 | 1.87 | 2007 | 3.29 |
| 1986 | 1.63 | 1997 | 1.65 | 2008 | 2.10 |
| 1987 | 1.90 | 1998 | 1.50 | 2009 | 2.45 |
| 1988 | 1.77 | 1999 | 1.73 | 2010 | 2.97 |
| 1989 | 1.83 | 2000 | 1.85 | 2011 | 3.80 |
| 1990 | 2.25 | 2001 | 1.40 | 2012 | 3.91 |
Source: http://www.randomuseless.info/gasprice/gasprice.html
NEED TO REVIEW?
The graph of an equation is discussed in Appendix A.3, pp. A-16 to A-20.
The graph shows that for each date on the horizontal axis there is only one price on the vertical axis. So, the graph represents a function, although the rule for determining the price from the year is not given.
When a function is defined by an equation in \(x\) and \(y\), the graph of the function is the set of points \(( x,y) \) in the \(xy\)-plane that satisfy the equation.
6
But not every collection of points in the \(xy\)-plane represents the graph of a function. Recall that a relation is a function only if each element \(x\) in the domain corresponds to exactly one image \(y\) in the range. This means the graph of a function never contains two points with the same \(x\)-coordinate and different \(y\)-coordinates. Compare the graphs in Figures 7 and 8. In Figure 7 every number \(x\) is associated with exactly one number \(y,\) but in Figure 8 some numbers \(x\) are associated with three numbers \(y.\) Figure 7 shows the graph of a function; Figure 8 shows a graph that is not the graph of a function.
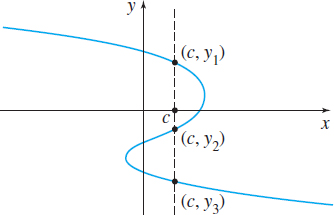
For a graph to be a graph of a function, it must satisfy the Vertical-line Test.
NOTE
The phrase “if and only if” means the concepts on each side of the phrase are equivalent. That is, they have the same meaning.
THEOREM Vertical-line Test
A set of points in the \(xy\)-plane is the graph of a function if and only if every vertical line intersects the graph in at most one point.
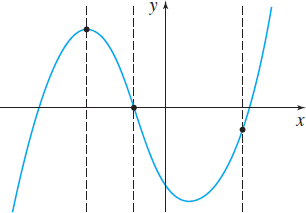
Identifying the Graph of a Function
Which graphs in Figure 9 represent the graph of a function?
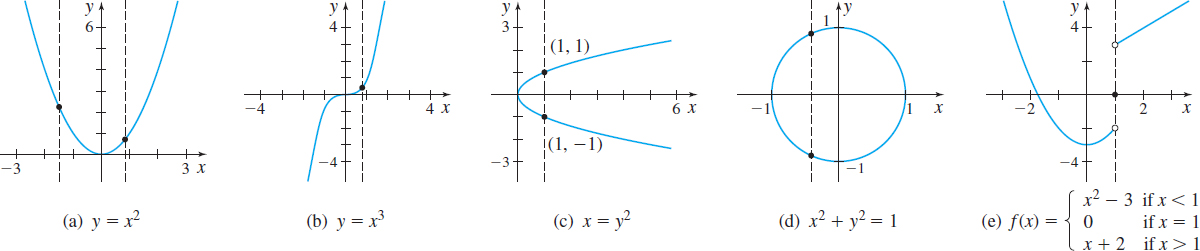
Solution The graphs in Figure 9(a), 9(b), and 9(e) are graphs of functions because every vertical line intersects each graph in at most one point. The graphs in Figure 9(c) and 9(d) are not graphs of functions, because there is a vertical line that intersects each graph in more than one point.
NOW WORK
Problems 31(a) and (b).
Notice that although the graph in Figure 9(e) represents a function, it looks different from the graphs in (a) and (b). The graph consists of two pieces plus a point and they are not connected. Also notice that different equations describe different pieces of the graph. Functions with graphs similar to the one in Figure 9(e) are called piecewise-defined functions.
4 Analyze a Piecewise-Defined Function
7
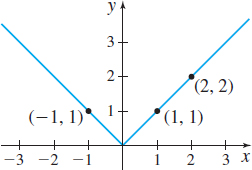
Sometimes a function is defined differently on different parts of its domain. For example, the absolute value function \(f( x) =\vert \,x\vert \) is actually defined by two equations: \(f( x) =x\) if \(x\geq 0\) and \(f( x) =-x\) if \(x<0.\) These equations are usually combined into one expression as \[ f( x) =\vert x\vert =\left\{ \begin{array}{c@{\quad}c@{\quad}c} x & {\rm if} & x\geq 0 \\ - x & {\rm if} & x \lt 0 \end{array} \right. \]
Figure 10 shows the graph of the absolute value function. Notice that the graph of \(f\) satisfies the Vertical-line Test.
When a function is defined by different equations on different parts of its domain, it is called a piecewise-defined function.
RECALL
\(x\)-intercepts are numbers on the \(x\)-axis at which a graph touches or crosses the \(x\)-axis.
Analyzing a Piecewise-Defined Function
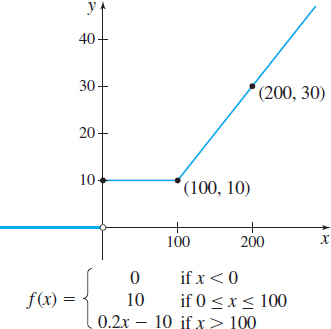
The function \(f\) is defined as \[ f( x) =\left\{ \begin{array}{c@{\qquad}l} 0 & \hbox{if }x \lt 0 \\ 10 & \hbox{if }0\leq x\leq 100 \\ 0.2x-10 & \hbox{if }x \gt 100 \end{array} \right. \]
- Evaluate \(f( -1) ,\) \(f( 100) \), and \(f(200)\).
- Graph \(f.\)
- Find the domain, range, and the \(x\)- and \(y\)-intercepts of \(f.\)
Solution (a) \(f( -1) =0;\) \(f( 100) =10;\) \(f( 200) =0.2( 200) -10=30\)
(b) The graph of \(f\) consists of three pieces corresponding to each equation in the definition. The graph is the horizontal line \(y= 0\) on the interval \(( -\infty ,0) ,\) the horizontal line \(y=10\) on the interval \([ 0,100] \), and the line \(y=0.2x-10\) on the interval \(( 100,\infty ) \), as shown in Figure 11.
(c) \(f\) is a piecewise-defined function. Look at the values that \( x\) can take on: \(x<0,\) \(0\leq x\leq 100,\) \(x>100.\) We conclude the domain of \(f\) is all real numbers. The range of \(f\) is the number \(0\) and all real numbers greater than or equal to \(10.\) The \(x\)-intercepts are all the numbers in the interval \(( -\infty ,0) \); the \(y\)-intercept is \( 10 \).
NOW WORK
Problem 33.
5 Obtain Information from or about the Graph of a Function
The graph of a function provides a great deal of information about the function. Reading and interpreting graphs is an essential skill for calculus.
Obtaining Information from the Graph of a Function
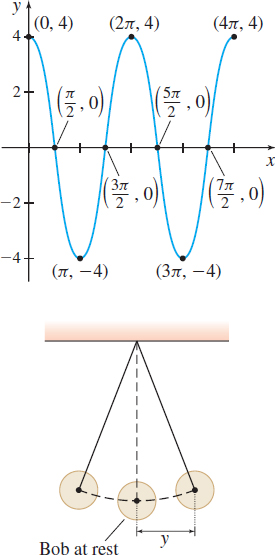
The graph of \(y= f( x) \) is given in Figure 12. (\(x\) might represent time and \(y\) might represent the distance of the bob of a pendulum from its at-rest position. Negative values of \(y\) would indicate that the bob is to the left of its at-rest position; positive values of \(y\) would mean that the bob is to the right of its at-rest position.)
- What are \(f( 0) \), \(f\left( \dfrac{3\pi }{2}\right) \), and \(f( 3\pi ) \)?
- What is the domain of \(f\)?
- What is the range of \(f\)?
- List the intercepts of the graph.
- How many times does the line \(y=2\) intersect the graph of \(f\)?
- For what values of \(x\) does \(f(x) =-4\)?
- For what values of \(x\) is \(f(x)>0\)?
8
Solution (a) Since the point \( ( 0,4 ) \) is on the graph of \(f\), the \(y\)-coordinate \(4\) is the value of \(f\) at \(0;\) that is, \( f ( 0 ) =4\). Similarly, when \(x=\dfrac{3\pi }{2}\), then \(y=0\), so \( f \left( \dfrac{3\pi }{2} \right) =0\), and when \(x=3\pi \), then \(y=-4\), so \( f ( 3\pi) =-4\).
(b) The points on the graph of \(f\) have \(x\)-coordinates between \( 0 \) and \(4\pi \) inclusive. The domain of \(f\) is \( \{ x|0\leq x\leq 4\pi \} \) or the closed interval \( [ 0,4\pi ] \).
(c) Every point on the graph of \(f\) has a \(y\)-coordinate between \( -4\) and \(4\) inclusive. The range of \(f\) is \( \{ y|{-}4\leq y\leq 4 \} \) or the closed interval \( [ -4,4 ] .\)
(d) The intercepts of the graph of \(f\) are \( ( 0,4 ) \), \( \left( \dfrac{\pi }{2},0 \right) \), \( \left( \dfrac{3\pi }{2},0 \right) \), \( \left( \dfrac{5\pi }{2},0 \right) \), and \(\left( \dfrac{7\pi }{2},0\! \right) \).
(e) Draw the graph of the line \(y=2\) on the same set of coordinate axes as the graph of \(f\). The line intersects the graph of \(f\) four times.
(f) Find points on the graph of \(f\) for which \(y=f ( x ) =-4\); there are two such points: \( ( \pi ,-4 ) \) and \( ( 3\pi ,-4 ) .\) So \(f ( x ) =-4\) when \(x=\pi \) and when \( x=3\pi\).
(g) \(f ( x ) >0\) when the \(y\)-coordinate of a point \( ( x,y ) \) on the graph of \(f\) is positive. This occurs when \(x\) is in the set \( \left[ 0,\dfrac{\pi }{2} \right) \cup \left( \dfrac{3\pi }{2} ,\dfrac{5\pi }{2} \right) \cup \left( \dfrac{7\pi }{2},4\pi \right]\).
RECALL
Intercepts are points at which a graph crosses or touches a coordinate axis.
NOW WORK
Problems 37, 39, 41, 43, 45, 47, and 49.
Obtaining Information about the Graph of a Function
Consider the function \(f ( x) =\dfrac{x+1}{x+2}\).
- What is the domain of \(f\)?
- Is the point \(\left( 1,\dfrac{1}{2}\!\right) \) on the graph of \(f\)?
- If \(x=2\), what is \(f( x) \)? What is the corresponding point on the graph of \(f\)?
- If \(f( x) =2\), what is \(x\)? What is the corresponding point on the graph of \(f\)?
- What are the \(x\)-intercepts of the graph of \(f\) (if any)? What point(s) on the graph of \(f\) correspond(s) to the \(x\)-intercept(s)?
Solution (a) The domain of \(f\) consists of all real numbers except \(-2;\) that is, the set \(\{ x|x\neq -2\} \).
(b) \[ \begin{eqnarray*} &&{\rm When}\ x=1, {\rm then}\ f ( 1 )\underset{\underset{\color{#0066A7}{x=1}}{\color{#0066A7}{\uparrow}}} {=} \dfrac{1+1}{1+2}=\dfrac{2}{3}. \hbox{The point } \left( 1, \dfrac{2}{3}\!\right) \hbox{ is on the graph of } f; \hbox{ the}\\ \end{eqnarray*} \] point \(\left( 1,\dfrac{1}{2}\!\right)\) is not on the graph of \(f\).
(c) \[ \begin{eqnarray*} &&\hbox{If } x=2, \hbox{then } f ( 2) \underset{\underset{\color{#0066A7}{x=2}}{\color{#0066A7}{\uparrow}}} {=} \dfrac{2+1}{2+2}=\dfrac{3}{4}. \hbox{The point } \left( 2, \dfrac{3}{4}\!\right) \hbox{ is on the graph of } f.\\ \end{eqnarray*} \]
(d) If \(f( x) =2\), then \(\dfrac{x+1}{x+2}=2.\) Solving for \(x\), we find \[ \begin{eqnarray*} x+1 &=&2( x+2) =2x+4 \nonumber \\ x &=&-3 \end{eqnarray*} \]
The point \(( -3,2) \) is on the graph of \(f\).
(e) The \(x\)-intercepts of the graph of \(f\) occur when \(y=0\). That is, they are the solutions of the equation \(f( x) =0\). The \(x\) -intercepts are also called the real zeros or roots of the function \(f\).
9
The real zeros of the function \(f( x) =\dfrac{x+1}{x+2}\) satisfy the equation \(x+1=0\) or \(x=-1\). The only \(x\)-intercept is \(-1\), so the point \(( -1,0) \) is on the graph of \(f.\)
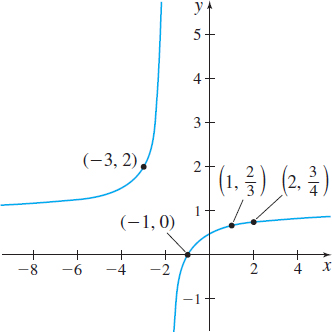
Figure 13 shows the graph of \(f.\)
NOW WORK
Problems 55, 57, 59.
6 Use Properties of Functions
One of the goals of calculus is to develop techniques for graphing functions. Here we review some properties of functions that help obtain the graph of a function.
spanDEFINITIONspan Even and Odd Functions
A function \(f\) is even if, for every number \(x\) in its domain, the number \(-x\) is also in the domain and \[\bbox[5px, border:1px solid black, #F9F7ED]{\bbox[#FAF8ED,5pt]{ f( -x) =f( x) }} \]
A function \(f\) is odd if, for every number \(x\) in its domain, the number \(-x\) is also in the domain and \[\bbox[5px, border:1px solid black, #F9F7ED]{\bbox[#FAF8ED,5pt]{ f( -x) =-f( x) }} \]
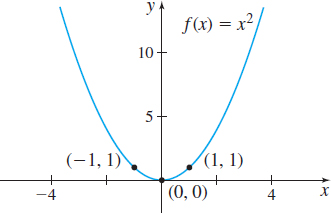
For example, \(f( x) =x^{2}\) is an even function since \[ f ( -x ) = ( -x ) ^{2}=x^{2}=f ( x ) \]
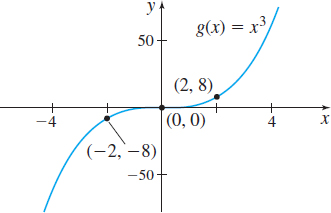
Also, \(g ( x ) =x^{3}\) is an odd function since \[ g ( -x ) = ( -x ) ^{3}=-x^{3}=-g ( x ) \]
NEED TO REVIEW?
Symmetry of equations is discussed in Appendix A.3, pp. A-17 to A-18.
See Figure 14 for the graph of \(f ( x ) =x^{2}\) and Figure 15 for the graph of \(g ( x ) =x^{3}.\) Notice that the graph of the even function \(f ( x ) =x^{2}\) is symmetric with respect to the \(y\)-axis and the graph of the odd function \(g ( x ) =x^{3}\) is symmetric with respect to the origin.
THEOREM Graphs of Even and Odd Functions
- A function is even if and only if its graph is symmetric with respect to the \(y\)-axis.
- A function is odd if and only if its graph is symmetric with respect to the origin.
Identifying Even and Odd Functions
Determine whether each of the following functions is even, odd, or neither. Then determine whether its graph is symmetric with respect to the \(y\)-axis, the origin, or neither.
- \(f ( x ) =x^{2}-5\)
- \(g ( x ) =\dfrac{4x}{x^{2}-5}\)
- \(h ( x ) =\sqrt[3]{5x^{3}-1}\)
- \(F ( x ) = \vert x \vert \)
- \(H ( x ) =\dfrac{x^{2}+2x-1}{ ( x-5 ) ^{2}}\)
10
Solution (a) The domain of \(f\) is \(( -\infty ,\infty ) \), so for every number \(x\) in its domain, \(-x\) is also in the domain. Replace \(x\) by \(-x\) and simplify. \[ f( -x) =( -x) ^{2}-5=x^{2}-5=f( x) \]
Since \(f( -x) =f( x) ,\) the function \(f\) is even. So the graph of \(f\) is symmetric with respect to the \(y\)-axis.
(b) The domain of \(g\) is \(\{ x|x\neq \pm \sqrt{5}\} \), so for every number \(x\) in its domain, \(-x\) is also in the domain. Replace \( x \) by \(-x\) and simplify. \[ g( -x) =\dfrac{4( -x) }{( -x) ^{2}-5}= \dfrac{-4x}{x^{2}-5}=-g( x) \]
Since \(g( -x) =-g( x) ,\) the function \(g\) is odd. So the graph of \(g\) is symmetric with respect to the origin.
(c) The domain of \(h\) is \(( -\infty ,\infty ) \), so for every number \(x\) in its domain, \(-x\) is also in the domain. Replace \(x\) by \(-x\) and simplify. \[ h( -x) = \sqrt[3]{5( -x) ^{3}-1}= \sqrt[3]{-5x^{3}-1}= \sqrt[3]{-( 5x^{3}+1) }=- \sqrt[3]{5x^{3}+1} \]
Since \(h( -x) \neq h( x) \) and \(h( -x) \neq -h( x) \), the function \(h\) is neither even nor odd. The graph of \( h\) is not symmetric with respect to the \(y\)-axis and not symmetric with respect to the origin.
(d) The domain of \(F\) is \(( -\infty ,\infty ) \), so for every number \(x\) in its domain, \(-x\) is also in the domain. Replace \(x\) by \(-x\) and simplify. \[ F( -x) =\vert {-}x\vert =\vert {-}1\vert \cdot \vert x\vert =\vert x\vert =F( x) \]
The function \(F\) is even. So the graph of \(F\) is symmetric with respect to the \(y\)-axis.
(e) The domain of \(H\) is \(\{ x|x\neq 5\}\). The number \(x=-5\) is in the domain of \(H\), but \(x=5\) is not in the domain. So the function \(H\) is neither even nor odd, and the graph of \(H\) is not symmetric with respect to the \(y\)-axis or the origin.
NOW WORK
Problem 61.
Another important property of a function is to know where it is increasing or decreasing.
spanDEFINITIONspan
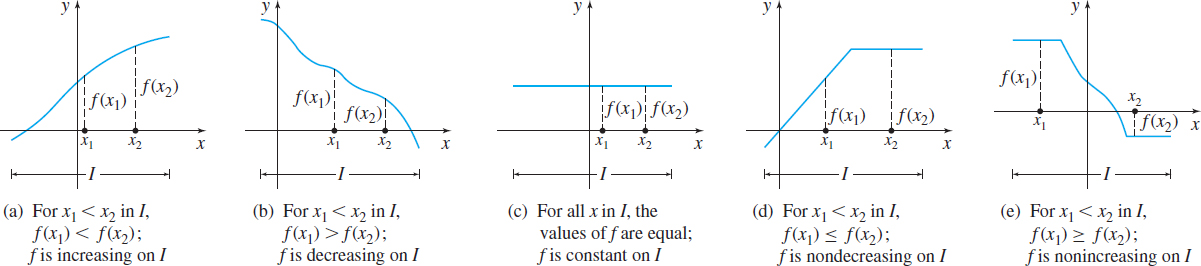
A function \(f\) is increasing on an interval \(I\), if, for any choice of \(x_{1}\) and \(x_{2}\) in \(I\), with \(x_{1}<x_{2}\), then \(f( x_{1}) <f( x_{2}) \).
A function \(f\) is decreasing on an interval \(I\), if, for any choice of \(x_{1}\) and \(x_{2}\) in \(I\), with \(x_{1}<x_{2}\), then \(f( x_{1}) >f( x_{2}) \).
A function \(f\) is constant on an interval \(I\), if, for all choices of \(x\) in \(I\), the values of \(f( x) \) are equal.
Notice in the definition for an increasing (decreasing) function \(f\), the value \(f( x_{1}) \) is strictly less than (strictly greater than) the value \(f( x_{2})\). If a nonstrict inequality is used, we obtain the definitions for nondecreasing and nonincreasing functions.
spanDEFINITIONspan
A function \(f\) is nondecreasing on an interval \( I\), if, for any choice of \(x_{1}\) and \(x_{2}\) in \(I\), with \(x_{1}<x_{2}\), then \(f ( x_{1}) \leq f ( x_{2}) \).
A function \(f\) is nonincreasing on an interval \(I\), if, for any choice of \(x_{1}\) and \(x_{2}\) in \(I\), with \(x_{1}<x_{2}\), then \(f ( x_{1}) \geq f ( x_{2}) \).
11
Figure 16 illustrates the definitions. In Chapter 4 we use calculus to find where a function is increasing or decreasing or is constant.
NOW WORK
Problem 51.
7 Find the Average Rate of Change of a Function
NOTE
From left to right, the graph of an increasing function goes up, the graph of a decreasing function goes down, and the graph of a constant function remains at a fixed height. From left to right, the graph of a nondecreasing function never goes down, and the graph of a nonincreasing function never goes up.
The average rate of change of a function plays an important role in calculus. It provides information about how a change in the independent variable \(x\) of a function \(y=f( x) \) causes a change in the dependent variable \(y\). We use the symbol \(\Delta x\), read “delta \(x\),” to represent the change in \(x\) and \(\Delta y\) to represent the change in \(y.\) Then by forming the quotient \(\dfrac{\Delta y}{\Delta x}\), we arrive at an average rate of change.
NOTE
\(\tfrac{\Delta y}{\Delta x}\) represents the change in \(y\) with respect to \(x\).
spanDEFINITIONspan Average Rate of Change
If \(a\) and \(b\), where \(a\neq b\), are in the domain of a function \(y=f( x) \), the average rate of change of \(f\) from \(a\) to \(b\) is defined as \[\bbox[5px, border:1px solid black, #F9F7ED]{\bbox[#FAF8ED,5pt]{ \dfrac{\Delta y}{\Delta x}=\dfrac{f( b) -f( a) }{b-a} \qquad a\neq b }} \]
Finding the Average Rate of Change
Find the average rate of change of \(f( x) =3x^{2}\):
- From \(1\) to \(3\)
- From \(1\) to \(x\), \(x\neq 1\)
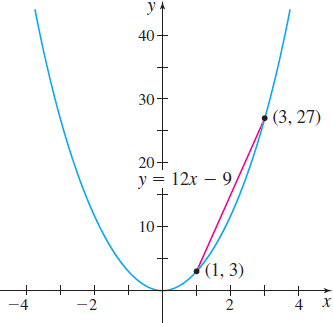
Solution (a) The average rate of change of \(f( x) =3x^{2}\) from \(1\) to \(3\) is \[ \dfrac{\Delta y}{\Delta x}=\dfrac{f( 3) -f( 1) }{3-1}= \dfrac{27-3}{3-1}=\dfrac{24}{2}=12 \]
See Figure 17.
Notice that the average rate of change of \(f( x) =3x^{2}\) from \( 1 \) to \(3\) is the slope of the line containing the points \(( 1,3) \) and \(( 3,27) .\)
(b) The average rate of change of \(f( x) =3x^{2}\) from \(1\) to \(x\) is \[ \begin{eqnarray*} \dfrac{\Delta y}{\Delta x}&=&\dfrac{f( x) -f( 1) }{x-1}= \dfrac{3x^{2}-3}{x-1}=\dfrac{3( x^{2}-1) }{x-1}\nonumber \\ &=&\dfrac{3(x-1) ( x+1) }{x-1}=3( x+1) =3x+3 \end{eqnarray*} \]
provided \(x\neq 1\).
NOW WORK
Problem 65.

12
Analyzing a Cost Function
The weekly cost \(C\), in dollars, of manufacturing \(x\) lightbulbs is \[ C ( x ) =7500+ \sqrt{125x} \]
- Find the average rate of change of the weekly cost \(C\) of manufacturing from \( 100\) to \(101\) lightbulbs.
- Find the average rate of change of the weekly cost \(C\) of manufacturing from \( 1000\) to \(1001\) lightbulbs.
- Interpret the results from parts (a) and (b).
Solution (a) The weekly cost of manufacturing \(100\) lightbulbs is \[ C ( 100 ) =7500+ \sqrt{125\cdot 100}=7500+ \sqrt{12{,}500}\approx \$7611.80 \]
The weekly cost of manufacturing \(101\) lightbulbs is \[ C ( 101 ) =7500+ \sqrt{125\cdot 101}=7500+ \sqrt{12{,}625}\approx \$7612.36 \]
The average rate of change of the weekly cost \(C\) from \(100\) to \(101\) is \[ \dfrac{\Delta C}{\Delta x}=\dfrac{C ( 101 ) -C ( 100 ) }{ 101-100}\approx \dfrac{7612.36-7611.80}{1}=\$0.56 \]
(b) The weekly cost of manufacturing \(1000\) lightbulbs is \[ C ( 1000) =7500+ \sqrt{125\cdot 1000}=7500+ \sqrt{125{,}000}\approx \$7853.55 \]
The weekly cost of manufacturing \(1001\) lightbulbs is \[ C ( 1001) =7500+ \sqrt{125\cdot 1001}=7500+ \sqrt{125{,}125}\approx \$7853.73 \]
The average rate of change of the weekly cost \(C\) from \(1000\) to \(1001\) is \[ \dfrac{\Delta C}{\Delta x}=\dfrac{C ( 1001) -C ( 1000) }{ 1001-1000}\approx \dfrac{7853.73-7853.55}{1}=\$0.18 \]
(c) Part (a) tells us that the cost of manufacturing the 101st lightbulb is $0.56. From (b) we learn that the cost of manufacturing the 1001st lightbulb is only $0.18. The unit cost per lightbulb decreases as the number of lightbulbs manufactured per week increases.
NOW WORK
Problem 73.