4.6 Assess Your UnderstandingPrinted Page 317
Skill Building
In Problems 1–42, use calculus to graph each function. Follow the steps for graphing a function.
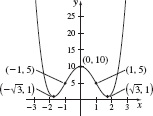
f(x)=x4−6x2+10
f(x)=x5−3x3+4
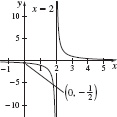
f(x)=1x−2
f(x)=2x+2
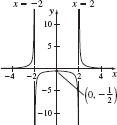
f(x)=2x2−4
f(x)=1x2−1
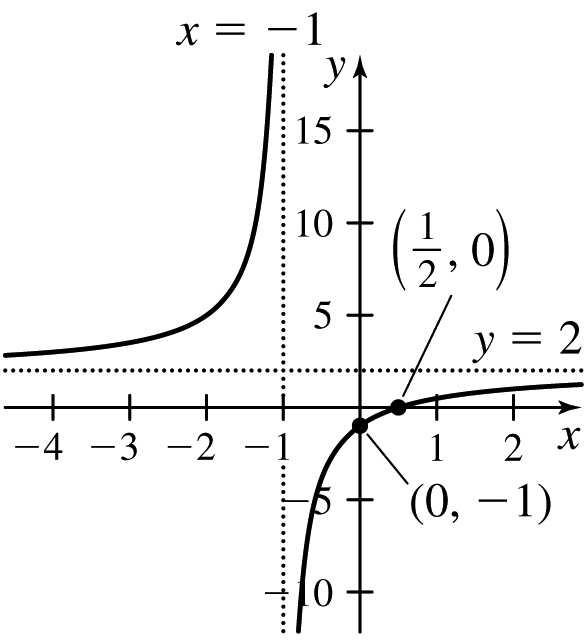
f(x)=2x−1x+1
f(x)=x−2x
f(x)=xx2+1
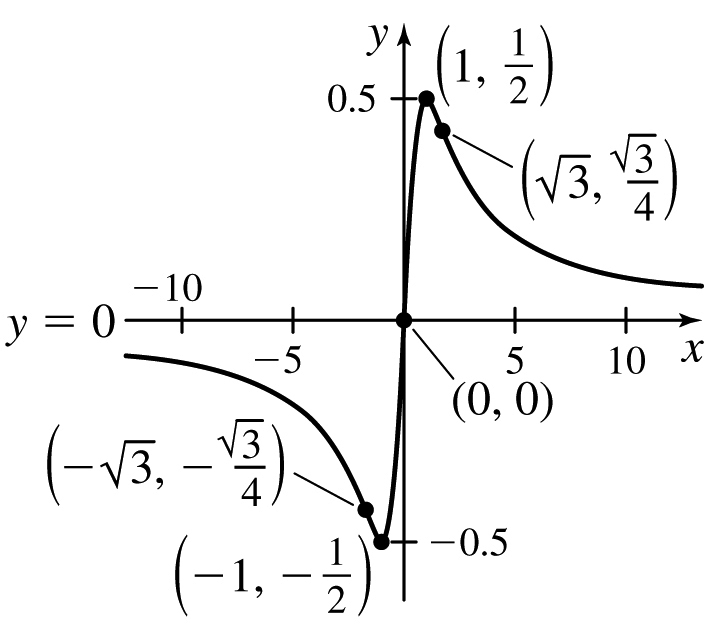
f(x)=2xx2−4
f(x)=x2+12x
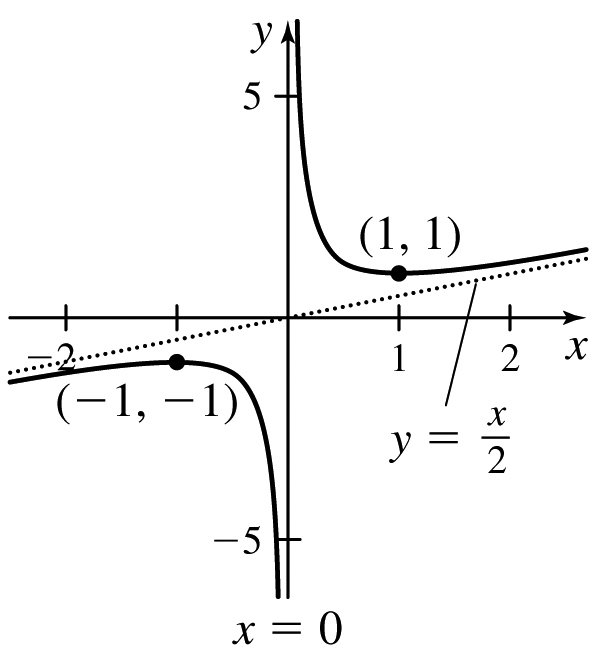
f(x)=x2−12x
f(x)=x4+1x2
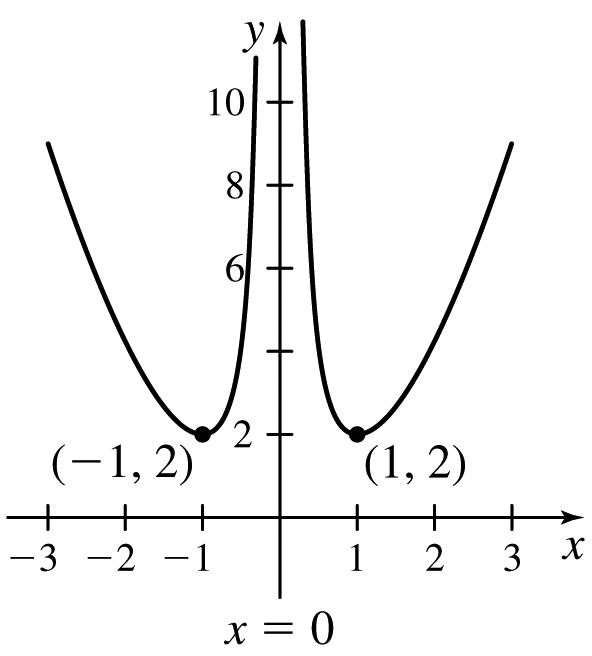
f(x)=x3+1x+1
xy=x2+2
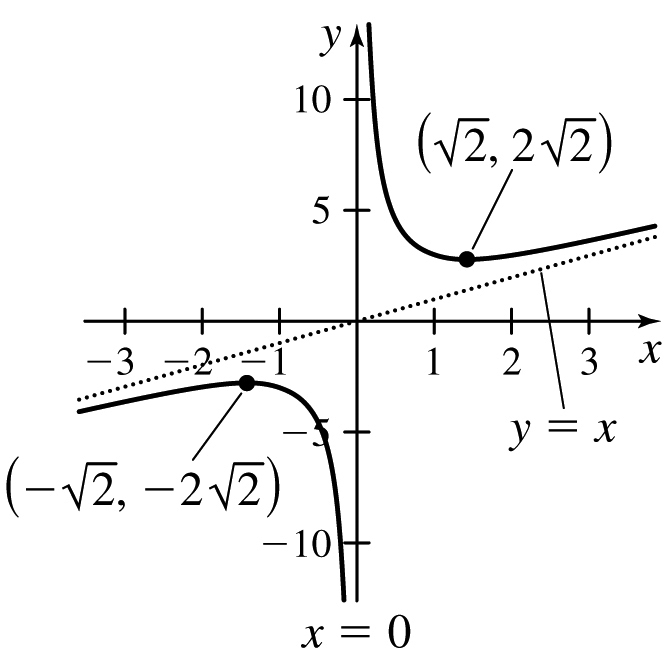
xy=x2+x−1
f(x)=x2x+3
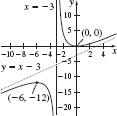
f(x)=3x2−1x−1
f(x)=1+1x+1x2
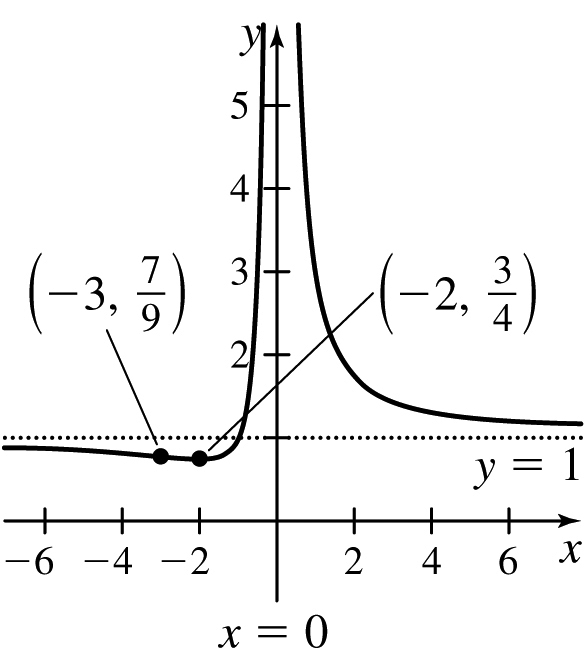
f(x)=2x+1x2
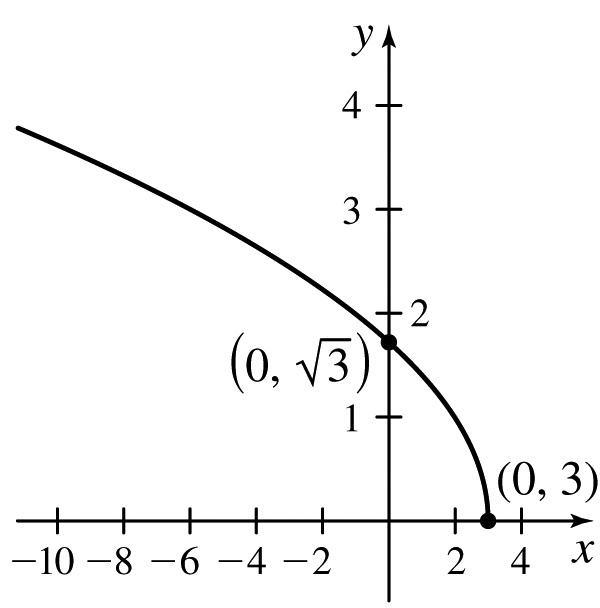
f(x)=√3−x
f(x)=x√x+2
f(x)=x+√x
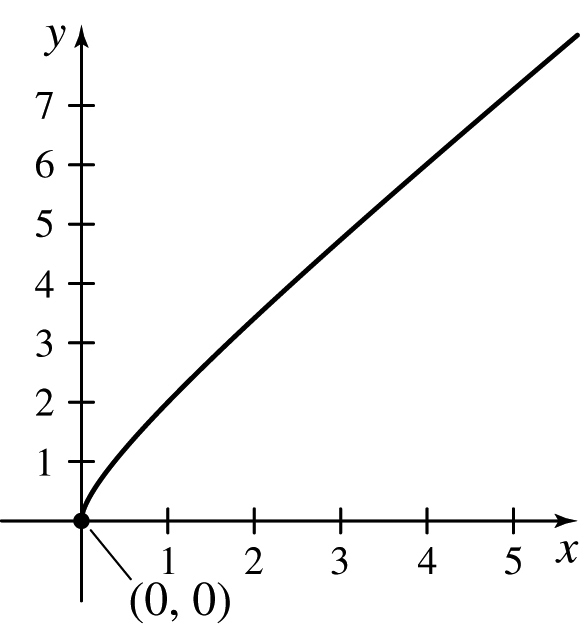
f(x)=√x−√x+1
f(x)=x2√x+1
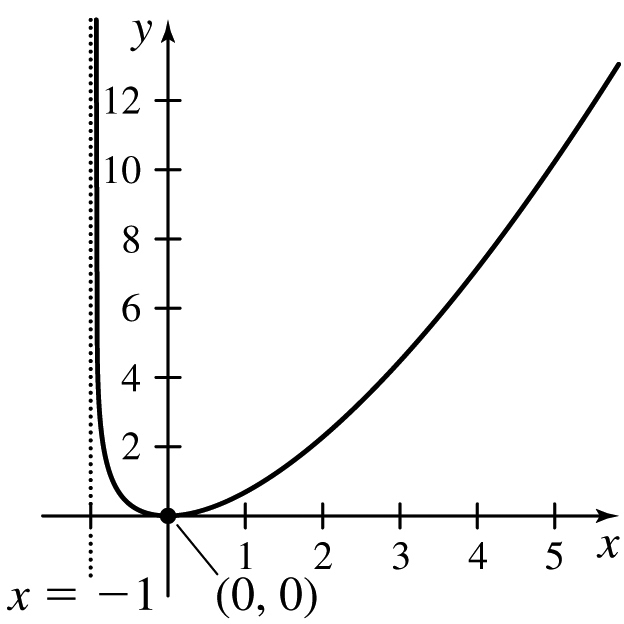
f(x)=x√x2+2
f(x)=1(x+1)(x−2)
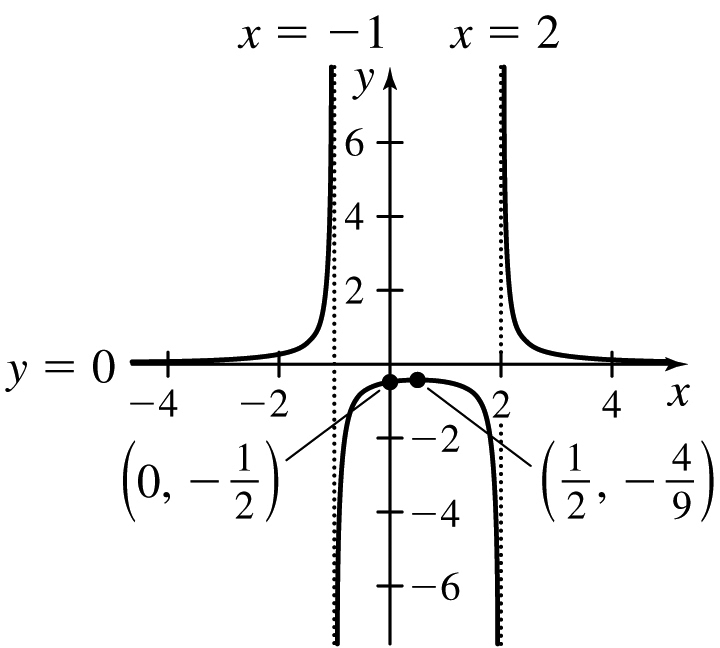
f(x)=1(x−1)(x+3)
f(x)=x2/3+3x1/3+2
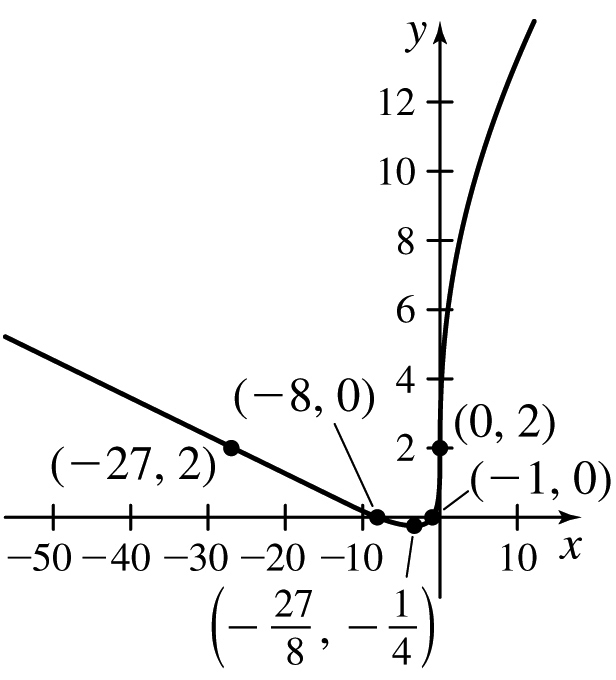
f(x)=x5/3−5x2/3
f(x)=sinx−cosx
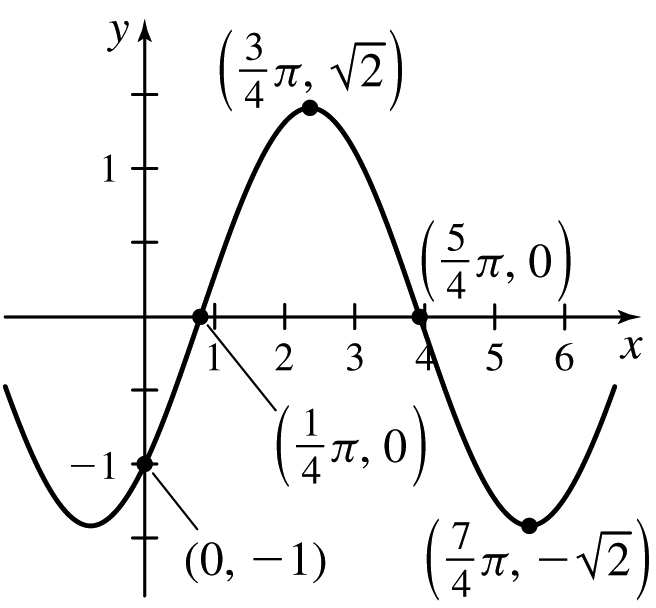
f(x)=sinx+tanx
f(x)=sin2x−cosx
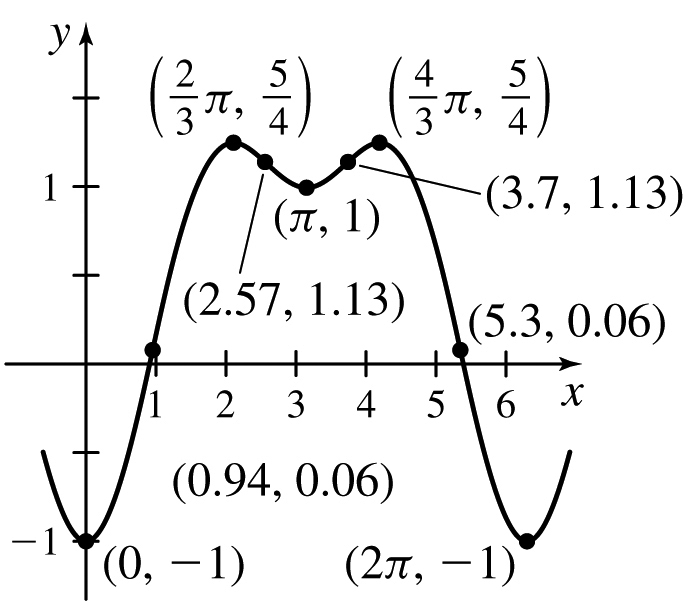
f(x)=cos2x+sinx
y=lnx−x
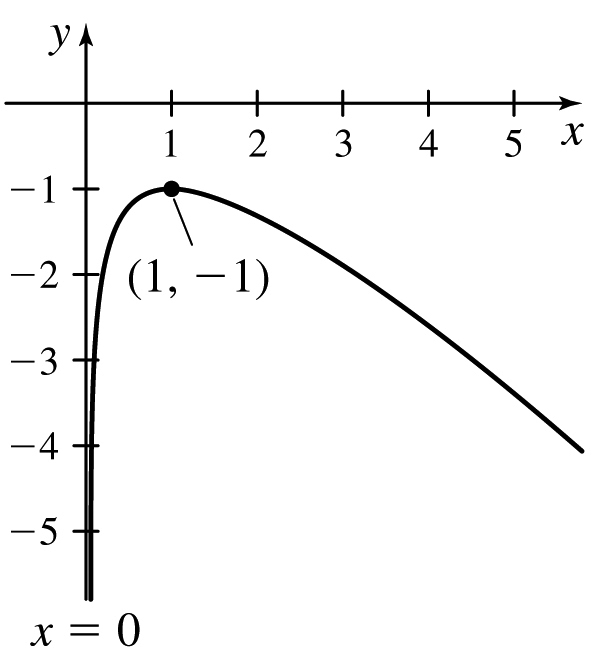
y=xlnx
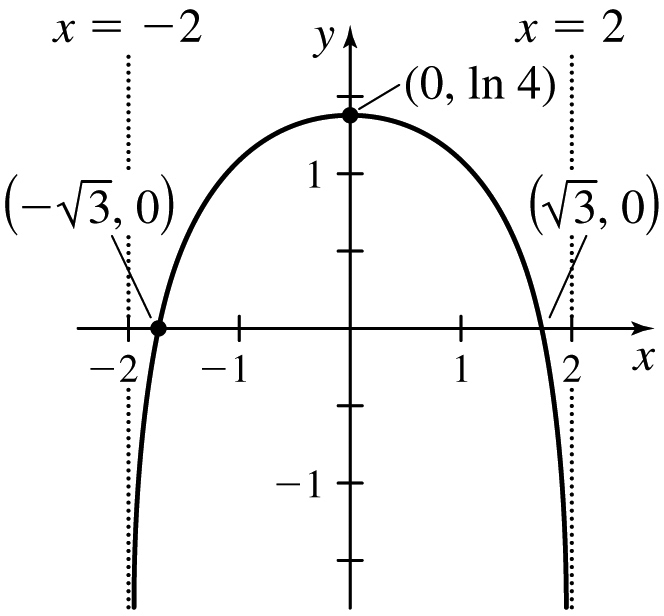
f(x)=ln(4−x2)
y=ln(x2+2)
f(x)=3e3x(5−x)
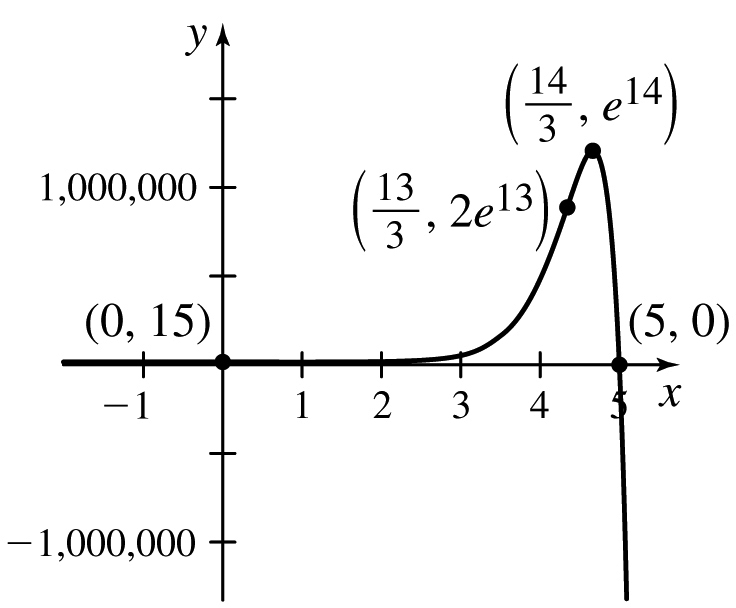
f(x)=3e−3x(x−4)
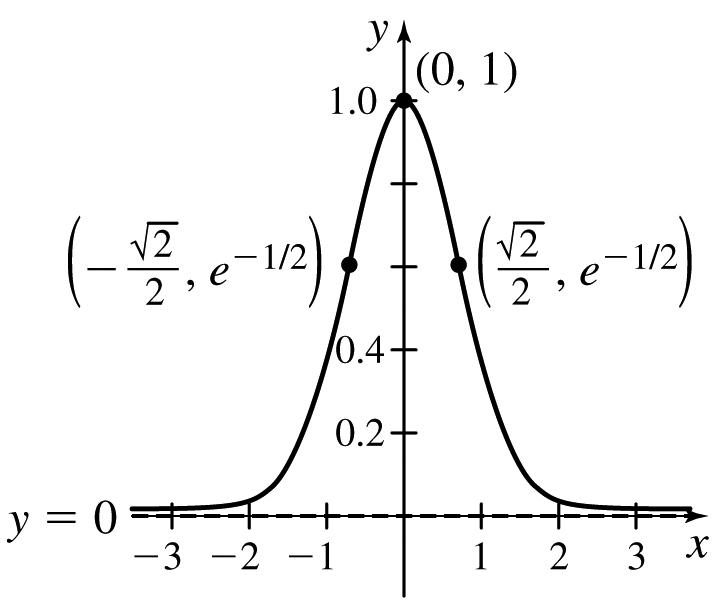
f(x)=e−x2
f(x)=e1/x
Applications and Extensions
![]() In Problems 43–52, for each function:
In Problems 43–52, for each function:
- (a) Use a CAS to graph the function.
- (b) Identify any asymptotes.
- (c) Use the graph to identify intervals on which the function increases or decreases and the intervals where the function is concave up or down.
- (d) Approximate the local extreme values using the graph.
- (e) Compare the approximate local maxima and local minima to the exact local extrema found by using calculus.
- (f) Approximate any inflection points using the graph.
f(x)=x2/3x−1
- (a)
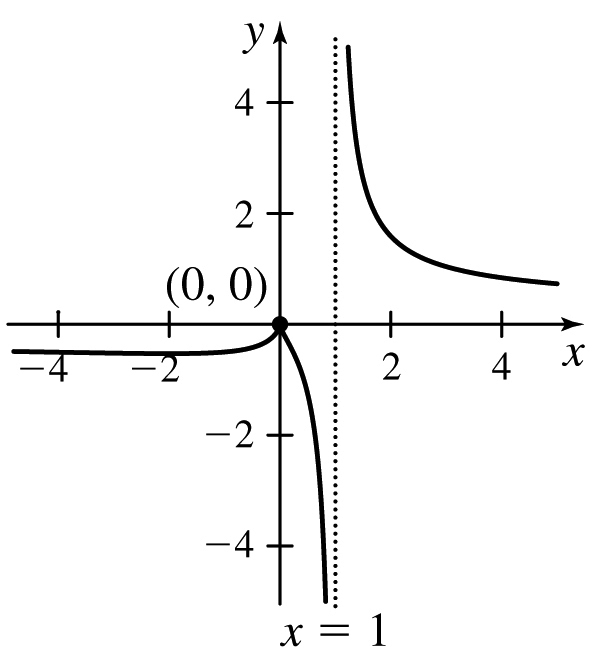
- (b) Vertical asymptote: x=1, horizontal asymptote: y=0
- (c) Decreasing on approximately (−∞,−2)∪(0,1)∪(1,∞) and increasing on approximately (−2,0), concave down on approximately (−∞,−4)∪(0.1,1) and concave up on approximately (−4,0)∪(0,0.1)∪(1,∞)
- (d) Local minimum value at approximately −2 and local maximum value at approximately 0
- (e) They are the same.
- (f) Points of inflection at approximately

f(x)=5−xx2+3x+4
f(x)=x+sin(2x)
- (a)
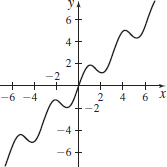
- (b) No asymptotes
- (c) Increasing on (−π3+kπ,π3+kπ) and decreasing on (π3+kπ,2π3+kπ) for k an integer, f is concave up on (−π2+kπ,kπ) and concave down on (kπ,π2+kπ) for k an integer.
- (d) Local maximum value at approximately π3+kπ and local minimum value at approximately 2π3+kπ for k an integer.
- (e) They are the same.
- (f)
 for k an integer.
f(x)=x−cosx
f(x)=ln(x√x−1)
- (a)
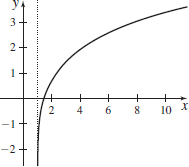
- (b) Vertical asymptote: x=1
- (c) Increasing and concave down on approximately (1,∞)
- (d) No local extrema
- (e) They are the same.
- (f) No points of inflection
f(x)=ln(tan2x)
f(x)=3√sinx
- (a)
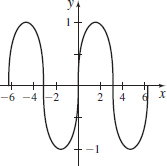
- (b) No asymptotes
- (c) Increasing approximately on (−π2+2kπ,π2+2kπ) and decreasing on (π2+2kπ,3π2+2kπ), concave up approximately on (−π+2kπ,2kπ) and concave down approximately on (2kπ,π+2kπ) for k an integer.
- (d) Local maximum value at approximately π2+2kπ and local minimum value at approximately 3π2+2kπ for k an integer.
- (e) They are the same.
- (f) Points of inflection at approximately (kπ, 0), k an integer.
f(x)=e−xcosx
y2=x2(6−x), y≥0
(a) 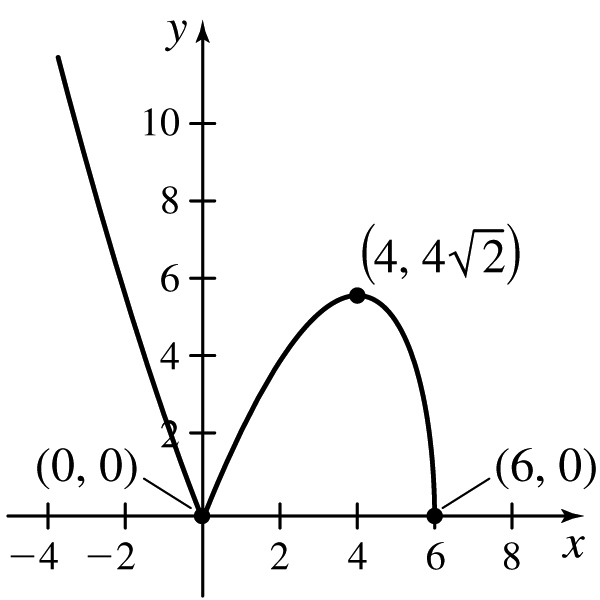
(b) No asymtotes.
(c) Decreasing on (- (4, 6); Increasing on (0, 4); Concave up on (-
(d) Local minimum value of 0 at x = 0, and local maximum value of  at x = 4.
(e) They are the same.
(f) There is an inflection point at (0, 0).
y2=x2(4−x2), y≥0
318
In Problems 53–56, graph a function f that is continuous on the interval [1,6] and satisfies the given conditions.
f′(2) does not existf′(3)=−1f′′(3)=0f′(5)=0f′′(x)<0,2<x<3f′′(x)>0,x>3
Answers will vary.
f′(2)=0f′′(2)=0f′(3) does not existf′(5)=0f′′(x)>0,2<x<3f′′(x)>0,x>3
f′(2)=0lim
Answers will vary.
\begin{array}[t]{l} f^\prime (2)=0 \\ \lim\limits_{x\rightarrow 3^{-}}\,f^\prime (x)=-\infty \\ \lim\limits_{x\rightarrow 3^{+}}{\,}f^\prime (x)=-\infty \\ f^\prime (5)=0 \\ f^{\prime \prime} (x)<0,\quad x<3 \\ f^{\prime \prime} (x)>0, \quad x>3 \end{array}
Sketch the graph of a function f defined and continuous for -1\leq x\leq 2 that satisfies the following conditions: \begin{array}{@{\hspace*{-1.7pc}}l} f(-1)= 1 \quad f(1) = 2 \quad f(2) = 3 \quad f(0) = 0 \quad f \left( {\dfrac{1}{2}}\right) =3\\[3pt] \quad \lim\limits_{x\rightarrow -1^{+}}f^\prime (x) =-\infty\quad \lim\limits_{x\rightarrow 1^{-}} f^\prime (x) = -1 \quad \lim\limits_{x\rightarrow 1^{+}} f^\prime (x)=\infty\\ {f\hbox{ has a local minimum at }0} \quad {f\hbox{ has a local maximum at }\dfrac{1}{2}} \end{array}
Answers will vary.
Graph of a Function Which of the following is true about the graph of y=\ln |x^{2}-1| in the interval (-1,1)?
- (a) The graph is increasing.
- (b) The graph has a local minimum at (0,0).
- (c) The graph has a range of all real numbers.
- (d) The graph is concave down.
- (e) The graph has an asymptote x=0.
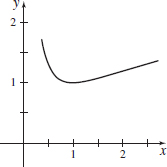
Properties of a Function Suppose f(x)=\dfrac{1}{x}+\ln x is defined only on the closed interval \dfrac{1}{e}\leq x\leq e.
- (a) Determine the numbers x at which f has its absolute maximum and absolute minimum.
- (b) For what numbers x is the graph concave up?
- (c) Graph f.
- (a) Absolute maximum value e-1 at x = \dfrac{1}{e} and absolute minimum value 1 at x =1
- (b) Concave up on \left(\dfrac{1}{e}, 2\right) and concave down on (2, e)
- (c)
Probability The function f(x)=\dfrac{1}{\sqrt{2\pi }} e^{-x^{2}/2}, encountered in probability theory, is called the standard normal density function. Determine where this function is increasing and decreasing, find all local maxima and local minima, find all inflection points, and determine the intervals where f is concave up and concave down. Then graph the function.
In Problems 61–64, graph each function. Use L’Hôpital’s Rule to find any asymptotes.
f(x)=\dfrac{\sin (3x)}{x\sqrt{4-x^{2}}}
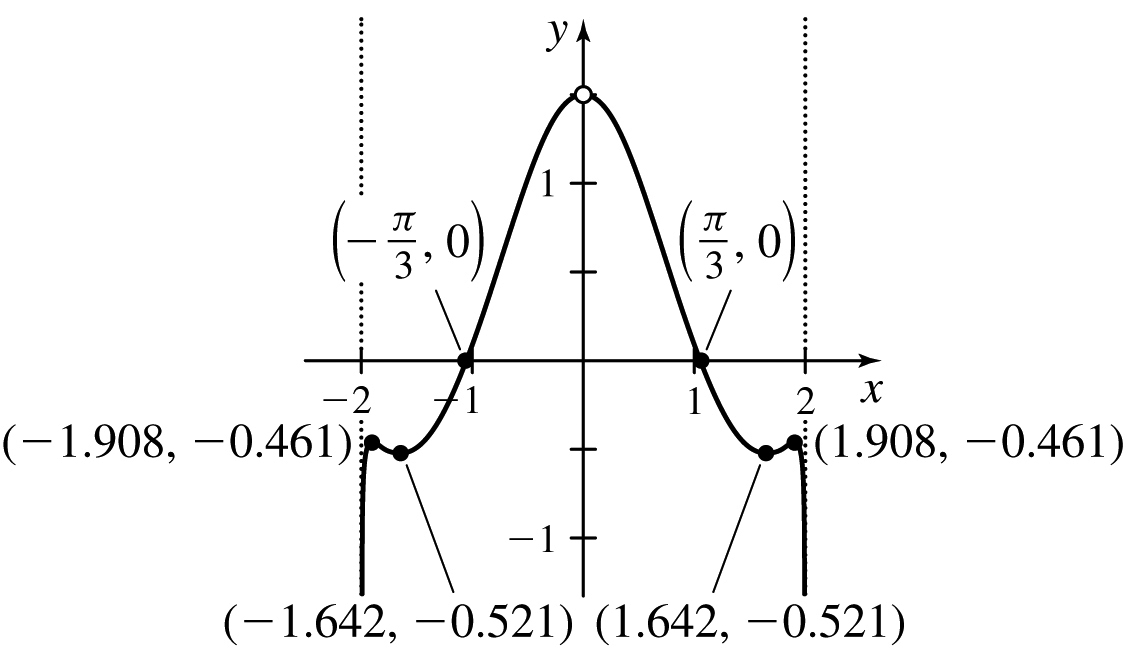
x = \pm 2 are two vertical asymptotes.
f(x)=x^{\sqrt{x}}
f(x)=~x^{1/x}
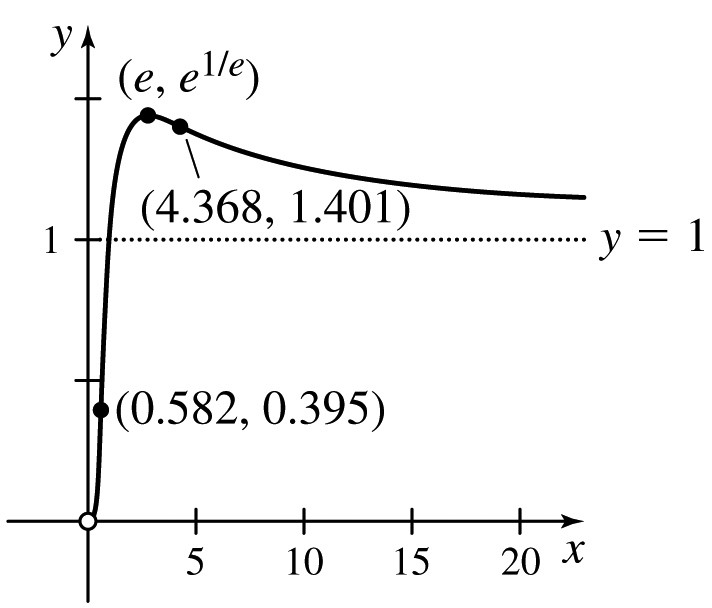
y = 1 is a horizontal asymptote.
y=\dfrac{1}{x}\tan x\quad -\dfrac{\pi }{2}<x<\dfrac{\pi}{2}
