Chapter 1. Scientific Method
Background Info
All scientific experiments begin with learning as much as possible about the subject first. To help with that, you’ve been provided with some background material on the scientific method, types of scientific data, and Brazilian ecosystems. Read this material thoroughly. Then, proceed to the comprehension questions that follow.
The scientific method
Biologists have two major approaches to science: observational and experimental. The observational approach is just what it sounds like: observing something about the natural world. The experimental approach is used to test a prediction that is based on an earlier observation.
The data gathered by a researcher can be either qualitative or quantitative. Qualitative data are descriptive. This could include observations such as:
- The color of a bird’s feathers
- How muscles are attached to bones
- The mating dances of birds
Quantitative data requires some kind of objective measurement. Time, temperature, weight, and volume are all things that are quantitative. Quantitative data could be:
- How many red feathers the bird has
- How much weight a muscle can lift
- How long each mating dance lasts
Very often, qualitative data leads to quantitative data. An investigation of a biological phenomenon generally starts with describing what exists. The next step is to try to understand the cause--an explanation of why something works the way it does. This is a process that everyone has used. For example, what if you pick up a flashlight, press the button, and nothing happens? Your observation is that the flashlight doesn’t work. You then would look for an explanation: maybe the batteries are dead. You would test this by replacing the old batteries with new ones. If the flashlight works, your explanation was correct, and your problem is solved. But if the flashlight still doesn’t work, you need a new idea. Maybe the light bulb is not working. That leads you to a new experiment: replacing the light bulb. You would keep testing your ideas until you found the right answer.
Now let’s look at an example from biology. A biologist might notice that a particular species of plant grows better in the summer than in the spring. But there could be many reasons why that would occur. It could be because the days are longer, or because the temperature is higher, or because there is greater rainfall in the summer. Any one of these factors, or possibly a combination of them, could improve plant growth. How could a biologist determine which is the true cause?
In order to learn the answer, the biologist first needs to develop a hypothesis. A hypothesis is a possible explanation for a previously observed phenomenon. In order for a hypothesis to be useful, it must be testable. This means that the hypothesis makes a prediction. Often this prediction can be phrased as an “If…then” type of statement. In this example, the biologist might hypothesize that longer days make the plant grow faster because the plant gets more sunlight. If more sunlight causes faster growth, then less sunlight should cause less growth. This is a testable statement with a yes/no answer. A variable is a factor or trait that changes in a predictable way when another condition changes. In this example, light and growth are both variables, and a change in one is predicted to cause a change in the other. The biologist can set up an experiment that will show whether this hypothesis is supported by quantitative data. This process of generating a hypothesis and testing it is called the scientific method.
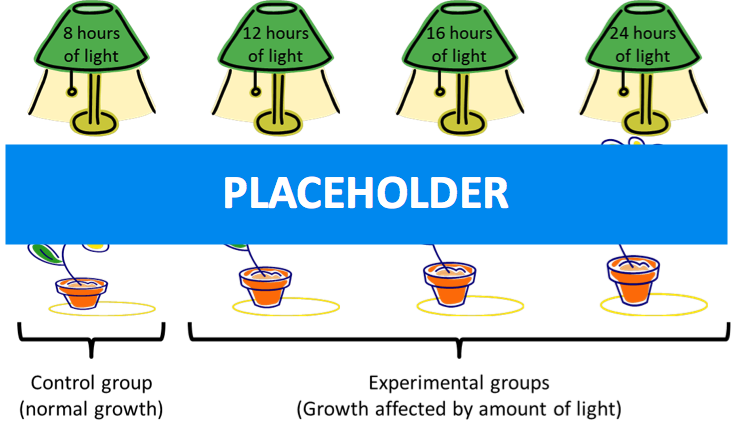
However, when setting up this experiment, the biologist must take into account the other factors that could affect the outcome. The best methodology is the controlled experiment. In this format, the biologist has one or more experimental groups and a control group. The control group is called this because the outcome of this experiment is controlled by the scientist. The only difference between the groups is the variable being tested. This way, nothing but that variable can affect the results. So in this example of a plant growth experiment, there will be four groups of plants. Each group is kept at the same temperature and receives the same amount of water. The only difference between them is that one is placed under lights for 8 hours a day (the control group), while the others are placed under lights for different amounts of time (the experimental groups). Therefore, if the group with more light grows the most, it can only be for one reason: increased light exposure is causing increased growth.
Data collection
Quantitative data obtained through an experiment is presented in some kind of graphic format. This makes the results easy to interpret. A graph will display an independent variable and a dependent variable. The independent variable is the “influencing factor” that controls the outcome of the experiment. Often it is the variable controlled by the scientist. In our example above, the independent variable is the amount of light exposure. The independent variable affects the dependent variable, which is the data actually measured by the scientist. The dependent variable is usually the focus or the outcome of the experiment. In our experiment, it is the growth of the plants. The amount of growth (our dependent variable, measured by measuring the height of the plants) is affected by the amount of light (the independent variable).
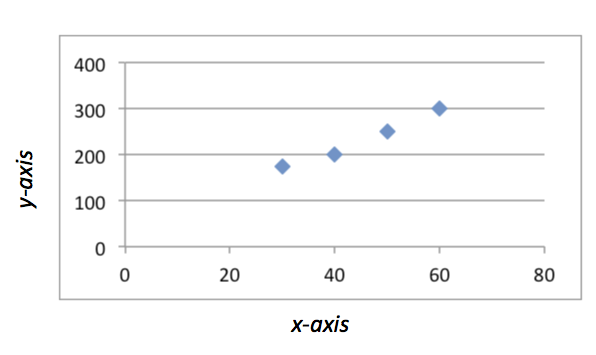
The dependent variable will always be on the y-axis (vertical axis) of the graph, and the independent variable will be on the x-axis (horizontal axis). The axes must be clearly labeled, including the units of measurement. It is necessary that someone be able to understand the experimental results simply by viewing the graph. An example of such a graph is given below.
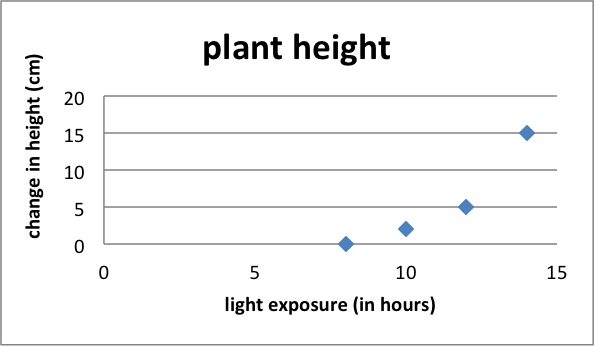
From reading this graph, it is clear that day length did have an effect on plant growth. As the days got longer, the plant grew more. This means that the hypothesis is supported. The word “proven” is almost never used by biologists. There might be other conditions under which this hypothesis would not be supported (for example, many plants can grow in the winter, when days are short). But for this experiment, this hypothesis can explain the observed phenomenon. Future experiments can be based on these results. For example, the next hypothesis might be that, since increasing day length increases growth, 24 hours of sunlight will cause even more growth. This is a testable hypothesis that is based on the results of this experiment.
What if the graph had looked like this?
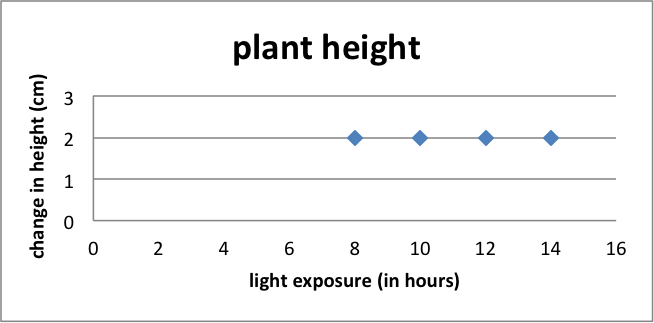
Here, it is obvious that light exposure had no effect on growth. In this case, the hypothesis would be rejected. Whatever is causing increased growth in the summer, it is definitely not light exposure. The biologist would then design a new experiment testing a completely different variable. Even though the hypothesis was not supported by the data, the biologist still learned something important from it, so this experiment was not a failure.
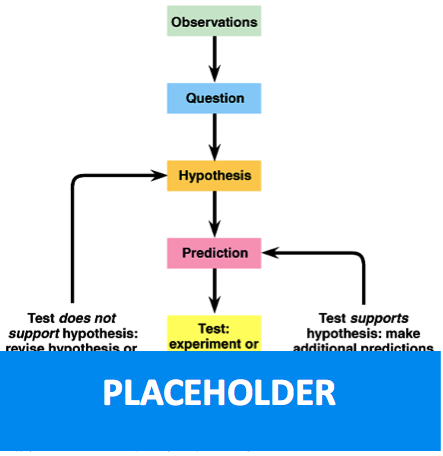
The steps involved in the scientific method are summarized here:
- An observation leads to a question. What is the cause of this phenomenon?
- A testable hypothesis is generated. The hypothesis proposes an answer to the question.
- A controlled experiment is designed to test the hypothesis.
- The results are graphed to demonstrate whether the hypothesis is supported or rejected by the data.
- If the hypothesis is supported, it can be accepted as an explanation for this phenomenon. More experiments may arise for further in-depth testing.
- If the hypothesis is rejected, the biologist must look for another explanation of this phenomenon and develop a new hypothesis to test it.
Using the scientific method for animal conservation
In this lab, you will be acting as an animal researcher for a major zoo. A newly discovered animal species from Brazil has just been brought to you. It is very rare in the wild; the specimens you have are the only ones in captivity and may be necessary to help reestablish the population in the wild. It is therefore very important that you be able to keep these animals alive, healthy, and reproducing. To do this, you will need to determine what kind of environment and diet they need. Unfortunately, the researchers who collected these specimens did not keep notes, and you have no idea where in Brazil the specimens were found. Those researchers have gone back to find more animals, so that eventually these animals can be returned to the wild. But until then, it is all up to you.
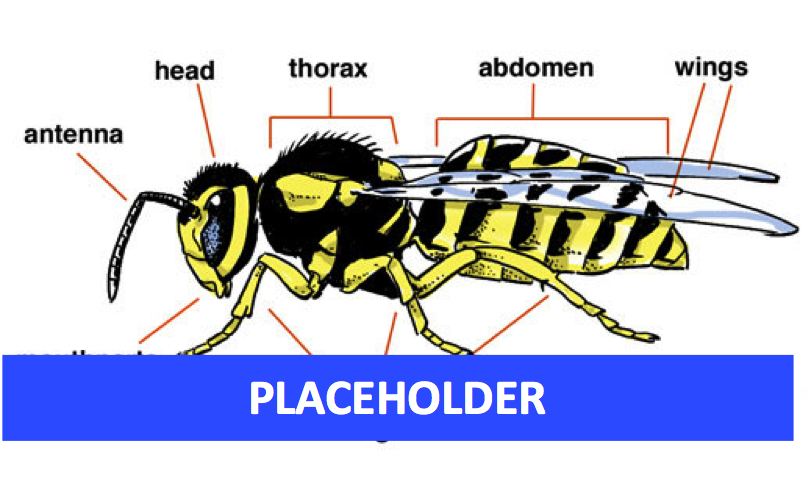
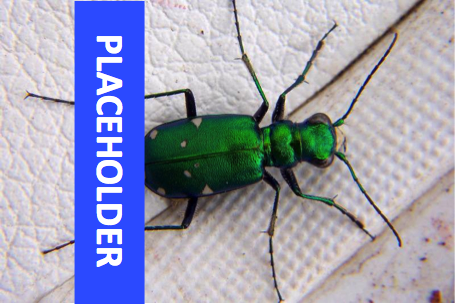
What observations can you make about these specimens? First, you can say that they are definitely insects. They have a hard exoskeleton, six legs, large compound eyes, wings, and long antennae. They have a bright green body with black spots near the back legs. Some are much larger than others.
What are some typical features of insects that might be useful to take into consideration?
- Most insects are herbivores and can do major damage to crops. However, there are definitely some insects that eat meat—generally other insects. For example, the praying mantis eats members of its own species!
- There are definitely examples of insects that eat meat, generally other insects.
- Some insects show sexual dimorphism, where males and females are very different in color and/or size.
- Some insects show a type of metamorphosis, where the young are essentially smaller versions of the adults.
- Insects cannot regulate their own body temperature and therefore depend on the external environment for energy. Very few insects fly at night because they cannot get warm enough to take off.
- Animals that live in deserts are adapted to need little water.
Brazil is a very diverse country with a wide range of ecosystems—combinations of nonliving and living features. What features of this country should you keep in mind as you study these insects?
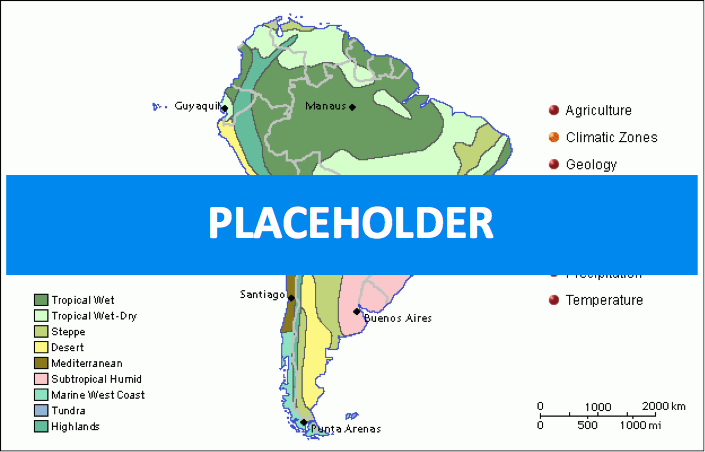
- Ecosystems vary from mountain to rainforest to deciduous forest to grassland to desert.
- Over most of the continent, average temperature is higher than 20° C (68° F) year round. However, the mountains and grasslands can get significantly colder.
- Rainfall and humidity range from very high in the rainforests to very low in the deserts.
So, there are many potential conditions these insects could have lived in. What conditions are the best for specimen habitat and diet? That is what you are going to determine, using the scientific method.
Pre-lab Quiz
Now that you have read the background information, answer the following questions. You must get a score of 90% or better on these questions to proceed to the first experiment.
1.
Choose whether each of the following represents qualitative or quantitative data.
• Weight of an animal in kilograms
• Describing the behavior of chickens in response to different light levels
• Height of a tree in meters
• Patterns of flight in different species of butterflies
2.
Put the steps of the scientific method in the correct order by first clicking the step number on the left and then clicking the description on the right.
Step 1 Step 2 Step 3 Step 4 | Question about the possible causes of a natural phenomenon Observation of a natural phenomenon Test to determine whether the hypothesis is supported or rejected Hypothesis about one proposed cause for a natural phenomenon |
3.
Choose ALL of the following statements that represent testable scientific hypotheses.
If bees cannot see the color red, then they will not be attracted to red flowers.
If life exists on Earth, then there must be life on other planets.
If you eat all the right foods, then you can prevent getting all types of disease.
If birds use the stars to navigate when they migrate, then putting the birds in unfamiliar areas should affect their migration patterns.
If your DNA contains all your genetic information, then a person’s genes completely determine the type of life they will lead.
4.
For each of the pairs below, determine which is the dependent variable and which is the independent variable:
• A medication that lowers blood pressure
Independent variable:
Dependent variable:
• The way plant growth is affected by different fertilizers
Independent variable:
Dependent variable:
• Air temperature and the rate of water evaporation from a leaf
Independent variable:
Dependent variable:
• Effect of an antibiotic on bacterial growth
Independent variable:
Dependent variable:
An experiment was done to study the effect of dietary fat intake on blood cholesterol levels. The hypothesis was that increasing fat intake would increase cholesterol levels. The results are shown below.
5.
Which is the independent variable?
6.
For each variable, choose whether it should go on the y-axis or x-axis of the graph.
Blood cholesterol levels in milligrams/deciliter
Dietary fat intake in grams/day
7.
What would be an appropriate control for this experiment?
| A. |
| B. |
8.
Do the data support or reject the hypothesis?
9.
Which of the following describe the animal you will be studying today? Select multiple correct answers.
Bird
Insect
Has eight legs
Has wings
Is blue
Is able to control its body temperature internally
10.
Which of the following ecosystems are NOT found in Brazil? Select multiple correct answers.
Rainforest
Tundra
Desert
Deciduous forest
Saltwater pond
Experiment Notebook
1.3.1 Observational Science and Qualitative Data
Your lab has been sent a collection of individuals from a newly discovered species found in Brazil. You’ve been tasked with discovering how best to keep these animals alive— the best habitat for them to live in, the best diet to feed them, etc. The data you collect will be used to construct the ideal zoo habitat for this species, which is very rare in the wild, so it is important these experiments be done carefully and accurately: eventually these animals will be returned to the wild.
In the space below, describe this new organism. Be as descriptive as possible:
We will first determine how this organism reacts to a variety of different stimuli. The table below lists these different objects and conditions to which we can expose the organism. For each, write your predictions for how you think the organisms will respond to these possible stimuli. Your predictions do not have to be correct (you only will be graded for entering a response) – they simply represent your best guess as to how the organisms will respond to the stimulus.
| Expected Response | |
|---|---|
| Apple | |
| Banana | |
| Meat | |
| Paper | |
| Paperclip | |
| Pear | |
| Rat Poison | |
| Uncooked Pasta |
Reviewers: For this demo, enter the word "response" in each of the boxes for credit.
Once your predictions are filled out, go to the experiment module and test each stimulus. They can all be found at the top of the screen. Click and drag each substance into one of the terrariums on the lab bench. You can only test one substance per terrarium. After you have recorded your observations in the table, click “Reset” to remove the substances from the terrariums. Be sure to test the organisms’ responses to every substance.
Reviewers: Please note that, for this demo, any responses entered above will not report to the interactive experiment module. In the actual lab activities, the responses that the student entered above would report to the interactive experiment module.
To return to this screen, simply close the lab module browser window. (Currently the red "exit" button in the lab module is not functional because we are in demo mode.)
______________________________________
Did any of the responses surprise you? Which of your predictions was furthest from the actual observed behavior?
What trends did you notice in how the organisms responded to the stimuli?
Using what you know about organisms so far, you are going to create a hypothesis, then design an experiment to test it. Remember, a good hypothesis is an idea, supported by observations, that leads to predictions that can be tested by experimentation. For example:
"I think that organisms like noise." (hypothesis) "So if we make different noises around the organisms, they will respond with increased activity." (prediction)
To test this hypothesis, we would expose the organisms to different types of noises, then observe and record the organisms' response.
In the next section, you are going to design and run your own experiment to test a hypothesis. To help you with this, you can choose from the various stimuli listed below:
| Hot water | Banana |
| Metal Paperclip | Shade |
| Cold water | Milk |
| Warm Oatmeal | Ammonia |
| Slice of Pear | Raw Pasta |
| Heat Lamp | Iodine |
| Cold Air | Ice |
| Cooked Macaroni | Meat |
| Hydrochloric Acid | Chopped nuts |
| Apple Juice | Paper |
Each of these substances is an independent variable that should have an effect on the insect’s behavior (the dependent variable). You need to create a hypothesis that leads to a prediction that can be tested with THREE of these substances. YOU DO NOT HAVE TO USE ALL OF THESE SUBSTANCES IN YOUR EXPERIMENT. NOTE: Many hypotheses are possible, you only have to devise and test one.
What is your hypothesis?
What three substances will you use to test your hypothesis? [NOTE: for demo purposes, we've used Meat, Slice of Pear, and Banana as the three menu choices here]
Good scientific experiments always include a control – something that we can compare our results to and see exactly what effect our experiment had.
For example, if we were testing to see if the organism responds favorably to noise, a good control would be organisms exposed to no noise at all. Any differences between them and the organisms that were subjected to noise could be recorded.
What will you use as the control in your experiment? [NOTE: For demo purposes, we're using Paper as the control here.]
Explain why you chose this as your control.
This is the end of Section 1 of this assignment. In the next section, we will actually run your experiment and collect data from it.
______________________________________
1.3.2 Running the Experiment
Your three test substances and control substance are now available for you to use. Before you begin, though, record your predicted responses. If your hypothesis is true, what response do you expect to see from the animal? Record it in the table below.
| Predicted Response | |
|---|---|
| Meat | |
| Slice of Pear | |
| Banana | |
| Paper |
Reviewers: For this demo, enter the word "response" in each of the boxes for credit.
Once you have recorded your predictions for each substance, click "Launch Experiment Module" to enter the laboratory, and test the substances with the organism. You will record the organism's responses to each substance, then return here once you have tested each item.
Reviewers: Note that, for this demo, the student's responses above will not report to the interactive experiment module. In the actual lab activity, the student's predictions would report to the interactive experiment module.
Again, simply close the lab module browser window to return to this screen; the "exit" button is currently not functional in demo mode.
____________________________________
Remember, your hypothesis was:
Site will automatically display student's hypothesis from Section 2
And your prediction was:
Site will automatically display student's prediction from Section 2
Based on your experiment, do you support or reject your hypothesis?
| A. |
| B. |
Explain why you would accept or reject your hypothesis here. Be specific!
IMPORTANT NOTE: In science, a rejected hypothesis is just as important as a supported one – BOTH are informative. It is more important that you be honest than that your hypothesis be correct!
In science, an experiment is never truly complete – there are always more things to test or new ways to continue an experiment. In the space below, write about one thing you would do next to continue this research – it could be new substances to test, or a way to better perform the experiment you just completed. Be creative!
1.3.3 Testing Multiple Variables
In this section, we will try to determine the best environment for keeping our new organism alive in the laboratory. We will want to mimic its natural environment as closely as possible. Your task is to figure out the optimal light and temperature levels for this organism. We have other people in the lab running experiments to determine the best humidity, soil type, vegetation, etc. (Remember, science is collaborative! Great scientists always work together!)
In this round of experiments, we are going to look at three different light levels – bright light, medium light, and low light – and five different temperatures – 10oC, 20oC, 30oC, 40oC, and 50oC.
We will want to test these conditions at the same time to see how they interact. For example, 20oC might have a different effect on our organism in bright light than it would in low light.
So, how many different terrariums will we need to test all possible combinations?
| A. |
| B. |
| C. |
| D. |
| E. |
| F. |
In the laboratory, you will be provided with multiple organisms to test in the different environments. You can only test one temperature at a time, but you can test all three possible light levels concurrently. Set up the conditions you want to test, and then record the organisms’ reactions. Click the “Reset” button to change the light levels and temperature. In the lab, you will record the results for testing one temperature and one light level combination. For each, first choose the light levels and temperature you want to test, then click “Begin.” The organisms will live in these environments for two days to see how they react. After the calendar shows that 48 hours have passed (in virtual lab time), record your observations as to how the organisms have responded to the environments you set up. After you record your observations, click the reset button to remove the organisms and select a different temperature and light levels.
________________________________
Were the results you recorded in this experiment qualitative or quantitative data?
What happened if the temperature dropped too low?
What happened when the temperature became too high?
Did the light level have any effect on the organisms’ reactions to the temperature?
Based on your results, what do you think would be the ideal environment for this organism in the zoo?
Brazil has a diverse array of habitats. Some of its ecosystems include:
- Rain forest – A hot, humid environment found in the areas of Brazil closest to the equator. It is usually heavily shaded by tall trees.
- Desert – Hot and arid, with very little cover or vegitation.
- Open-grassland—A temperate, open area with moderate temperature variations. The tall grasses would provide some shade and protection.
- Shaded forest – Temperatures here show a diverse range, but the density of the trees keep the area quite dark and protected.
Based on the results from this experiment, what do you think was the native environment for this organism?
| A. |
| B. |
| C. |
| D. |
Explain why you chose this environment.
1.3.4 Graphing Quantitative Data
The last thing we need to know about this new organism is what to feed it. To determine the best diet for this species, we will test a variety of different foods. Every day we will weigh the organisms. The best diet will be one that keeps the animal’s weight relatively constant – we don’t want them starving to death, but we don’t want them overweight either!
In this experiment, what is our independent variable?
| A. |
| B. |
| C. |
| D. |
Another independent variable in this experiment is time – the longer the insect spends on a certain diet, the stronger effect it will have.
In this experiment, what is our dependent variable?
| A. |
| B. |
| C. |
| D. |
In just a moment, you will return to the laboratory, where you will be provided with enough organisms to test five different diets. Three diets are preselected for you: an all water diet, an all leaf diet, and a dog food diet. You can choose the other two diets you want to test from the provided list.
You are going to do three repetitions for each diet. This means three organisms will eat that particular food. Once a week you will weigh all three organisms and calculate the average weight. You will record this information for seven weeks. Lastly, we will see which diet is the best for this particular species.
Why is every diet repeated three times?
| A. |
| B. |
| C. |
| D. |
Go to the laboratory and select two additional diets from the drop-down menus. Then, click the “Begin Experiment” button that will appear. The first step will be to get the initial weights of the organisms. Click and drag the three cages on one shelf onto the three scales on the table. Record the three weights in the appropriate box. The average will be calculated for you.
Once you have recorded the starting weights for all the organisms, click the button that says “Proceed One Week.” Seven days will pass on the calendar, and then it will be time to weigh the organisms again. Keep weighing the organisms, once a week, until 7 weeks have passed.
______________________________
Once you have all seven weeks of data ready, we will graph the information to make it easier to understand. On a graph, the independent variable usually goes on the x-axis (the vertical), and the dependent variable usually goes on the y-axis (the horizontal).
What would be the appropriate x-axis label for our graph?
What would be the appropriate y-axis label for our graph?
To graph each diet, you must first select it from the menu to the right of the graph. Click on the graph to locate each data point. For example, if the insects weighed 13 grams on Week 1, you would click halfway between the intersections of the line for Week 1 and the lines for 12 g and 14 g. Round each average weight to the nearest whole number.
Once you have graphed the data for all seven weeks for the first diet, click the “Submit Graph” button to save it. If at any point you make a mistake in graphing, click “Reset” to start over. Follow these same steps for each subsequent diet until you have graphed all five.
. When a diet is selected from that menu, the pointer changes color; there is a different color representing each diet. In the example here, the student has already graphed one diet and is part-way through graphing the second. Once a student has graphed all seven weeks of data, they click submit graph. The graph is saved, then cleared (but the axis labels stay the same), and the student can choose a diet to graph (which will be a new color). Clicking the “reset” button would delete ONLY the data points on the current graph (not the saved ones).")
(Once the student has completed all 5 graphs above...)
The results of all 5 diets are compiled on the graph below. This will allow you to easily compare their effects.
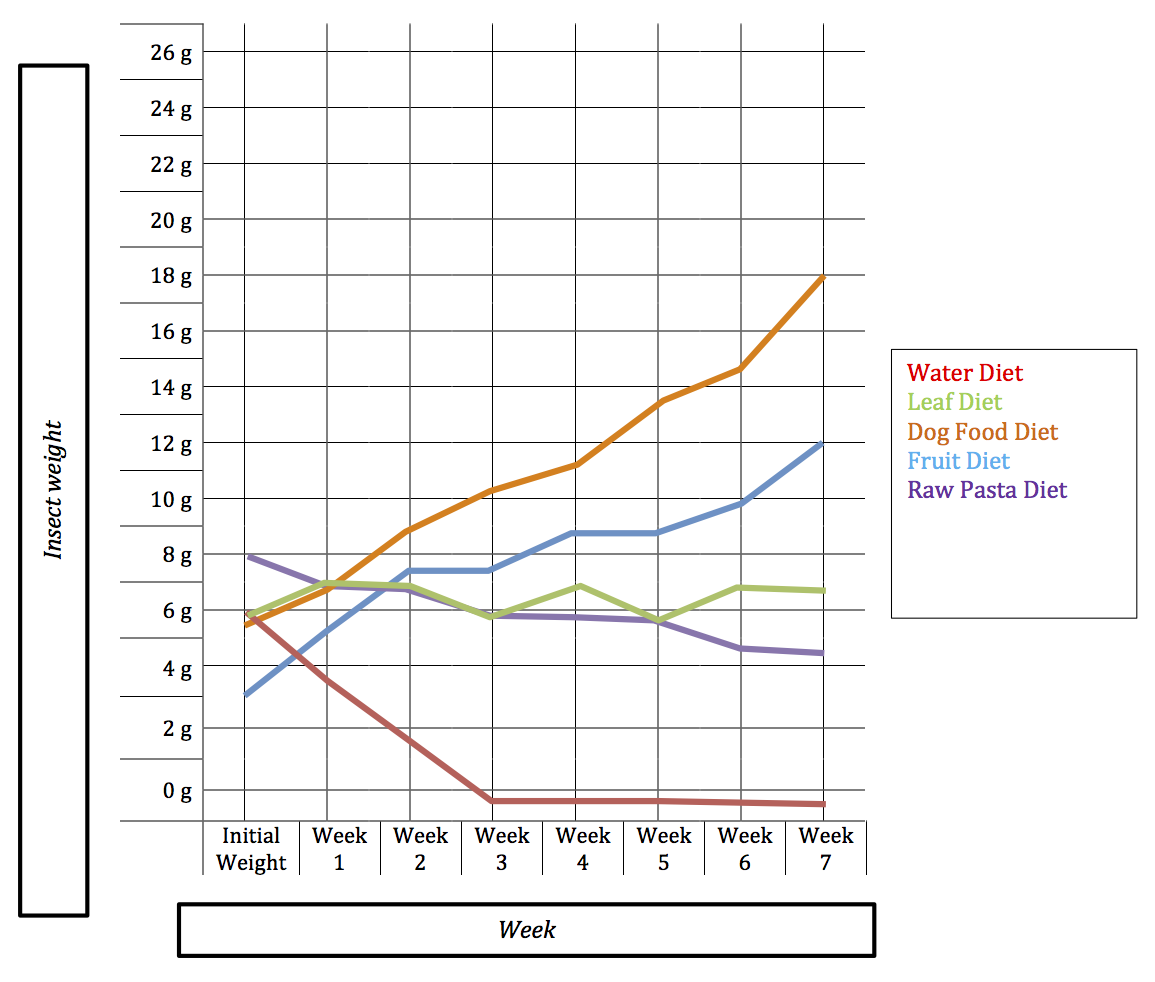
Which diet do you think was best for this organism?
| A. |
| B. |
| C. |
| D. |
| E. |
Explain your reasoning.
Which diet do you think was worst for this organism?
| A. |
| B. |
| C. |
| D. |
| E. |
Do you have a hypothesis as to why this diet was bad for this organism?
How would you test this hypothesis?
Congratulations! You have completed Lab #1 – Experimental Design! This means you have determined the ideal environment and the ideal diet to feed this organism and keep it alive in the zoo. The last step is going to be summarizing these experiments and your results in a lab report. Remember, you can go back and look at the sections you have already completed at any time. This will help you in writing your lab report.
Lab Report
11.
Purpose
Which of the following best described the purpose of the experiments we performed in this lab?
| A. |
| B. |
| C. |
| D. |
| E. |
12.
Introduction
Complete this partially written paragraph by choosing the correct words from the drop-down menus.
In this lab we investigated the characteristics of a newly discovered organism from . Since this organism may be used in future research projects, it is important to discover ways of keeping it alive and healthy . We conducted a scientific experiment to determine this organism’s features and characteristics. We also conducted hypothesis-based experiments to determine the organism’s optimal temperature and . data were collected to determine the best diet for this organism. As a result of our experimentation, we confident that an environment can be constructed to keep this organism alive and healthy.
13.
Materials
From the following list, select ONLY the tools and materials that were used in these experiments.
| Multiple specimens of the newly discovered organism | |
| Multiple specimens of a species closely related to the newly discovered organism | |
| Multiple stimuli to which to expose the organism | |
| Humidifier | |
| Light control boxes | |
| Soil samples from various parts of South America | |
| A dissection kit | |
| A scale to weigh the organism | |
| A ruler to measure the length of the organism | |
| Various foods to test with the organism | |
| Water from various sources to test with the organism |
14.
Methods
Put the steps from our experiments into the correct order.
Experiment 1
Step 1:
Step 2:
Step 3:
_____________________________
Experiment 2
Step 1:
Step 2:
Step 3:
_____________________________
Experiment 3
Step 1:
Step 2:
Step 3:
Step 4:
Step 5:
15.
Results and Discussion
To complete this section of the lab report, choose the correct response from the drop-down menus.
In the first experiment, the general traits and behaviors of this organism were determined. In the first round of testing, the organism seemed to respond well to but the had a negative effect. After testing all the starting substances, a new was created and tested. The organisms were exposed to different substances; this was the . The organisms’ responses to the substances were recorded; this was the .
In the second experiment, different combinations of temperature and light-level were tested to see which was the optimal environment for this organism. Temperature choices ranged from 10oC to oC, and the tested light levels were low, medium, and high. The data collected at each temperature/light combination seemed to indicate that the optimal environment seemed to be light and oC. Because of this, it was theorized that the organism’s native environment was a habitat.
In the final experiment, different diets were tested over a period of weeks. data averaged from different individuals for each diet indicated that the diet was best for this species. The data for this diet is shown in the graph below.
The data also indicated that was the worst diet for this species from those tested.