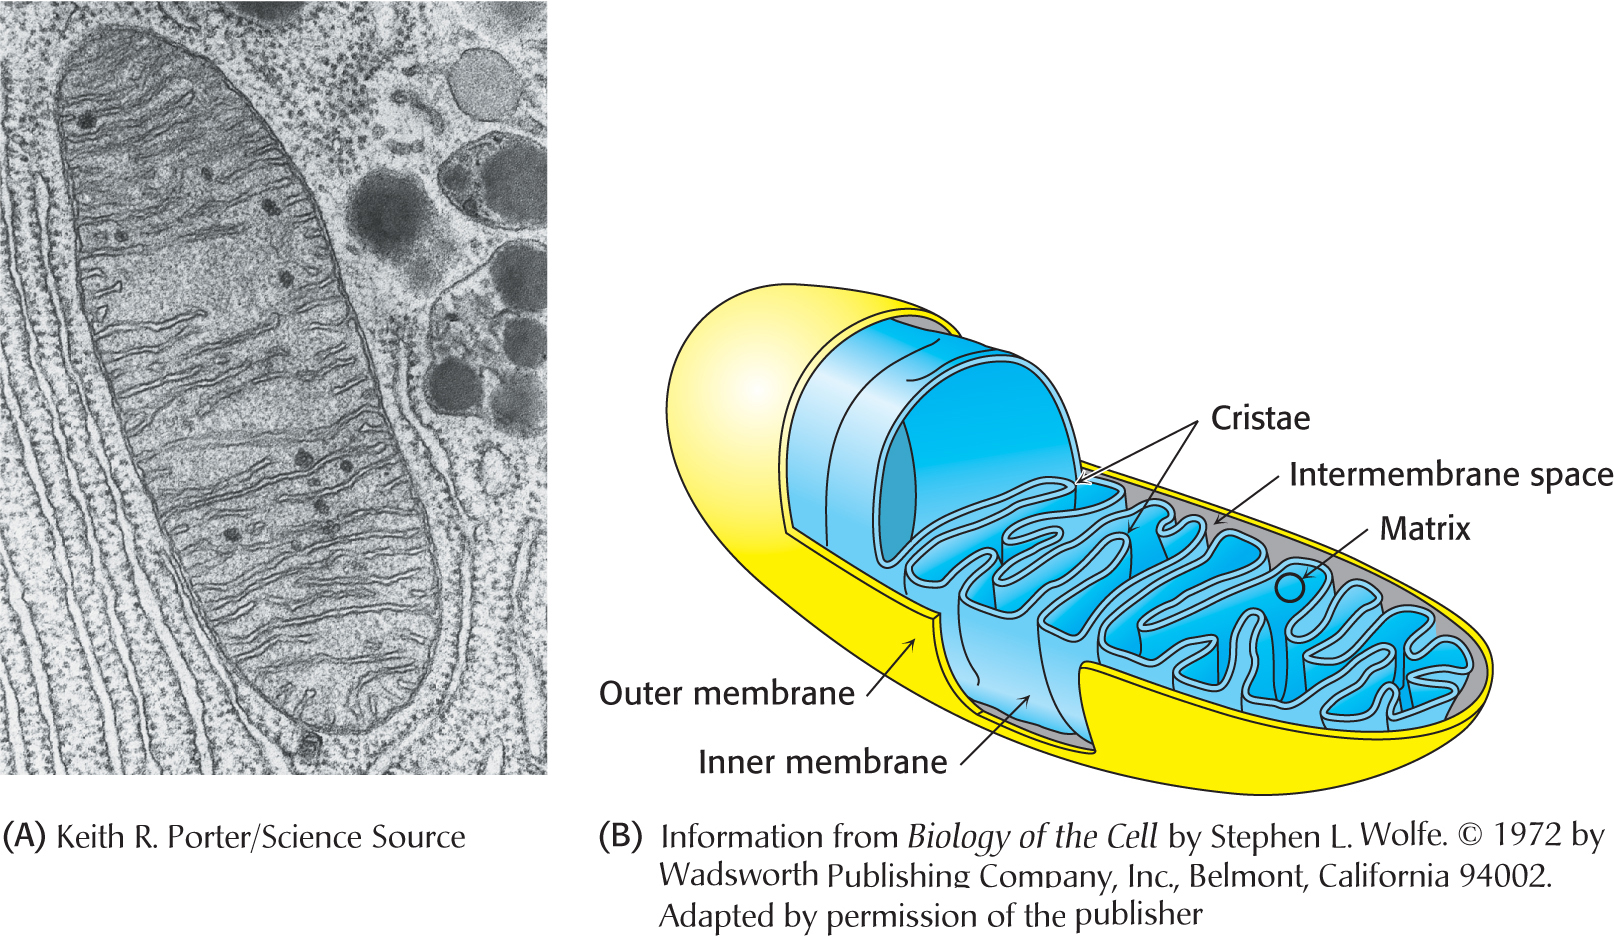
Figure 20.2
Electron micrograph (A) and diagram (B) of a mitochondrion
.
[
Leave
] [
Close
]
Next