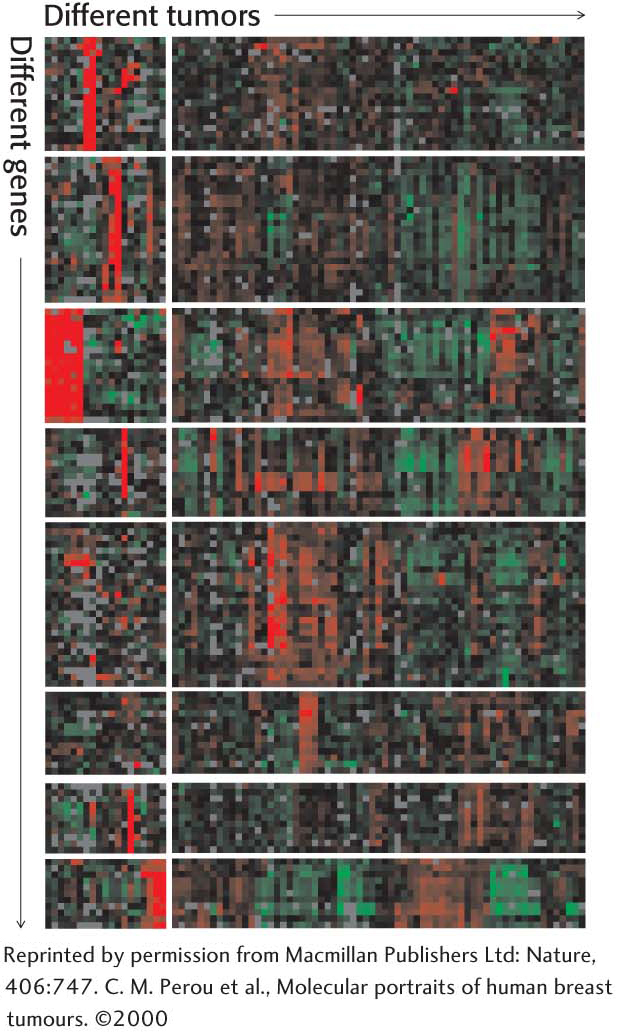
Figure 41.18 Gene-expression analysis with microarrays. The expression levels of thousands of genes can be simultaneously analyzed by using DNA microarrays (gene chips). Here, the analysis of 1733 genes in 84 breast-tumor samples reveals that the tumors can be assorted into distinct classes on the basis of their gene-expression patterns. Red corresponds to gene induction, and green corresponds to gene repression.
[Leave] [Close]