Chapter 7
A first-
order rate constant is a proportionality constant for reactions having only one reactant; it relates the rate of a reaction to the concentration of the sole reactant. First- order rate constants have the unit s−1. A second- order rate constant is a proportionality constant for reactions having two reactants; it relates the rate of a reaction to the concentration of both reactants. Second- order rate constants have the unit M−1 s−1. Page C7A second-
order reaction that appears to be first order. If the concentration of one reactant is much greater than that of the second reactant, the velocity will appear to be first order with respect to the reactant present in the lower concentration. At substrate concentrations near the KM, the enzyme displays significant catalysis yet is sensitive to changes in substrate concentration.
Sequential reactions are characterized by the formation of a ternary complex consisting of the enzyme and both substrates. Double-
displacement reactions always require the formation of a temporarily substituted enzyme intermediate. No, KM is not equal to the dissociation constant, because the numerator also contains k2, the rate constant for the conversion of the enzyme–
substrate complex into enzyme and product. If, however, k2 is much smaller than k−1, KM ≈ KD. (a) Yes, KM = 5.2 × 10⁻⁶ M; (b) Vmax = 6.8 × 10⁻¹⁰ mol minute−1; (c) 337 s−1
(a) 31.1 µmol; (b) 0.05 µmol; (c) 622 s−1, which is a midrange value for enzymes (Table 6.2)
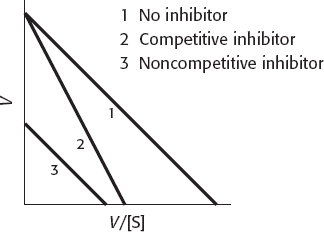
V = Vmax − (V/[S])KM
Slope = −KM, y-intercept = Vmax, x-intercept = Vmax/KM
1.1 µmol minute−1
Complete the interactive matching exercise to see answers.

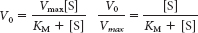
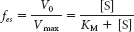
When [S] = 10 KM, V0/Vmax = 0.91, and when [S] = 20 KM, V0/Vmax = 0.95. So, any Michaelis–Menten curves showing that the enzyme actually attains Vmax are pernicious lies. The inhibition of an allosteric enzyme by the end product of the pathway controlled by the enzyme. Feedback inhibition prevents the production of too much end product and the consumption of substrates when product is not required.
The enzyme would show simple Michaelis–
Menten kinetics because it is essentially always in the R state. Homotropic effectors are the substrates of allosteric enzymes. Heterotropic effectors are the regulators of allosteric enzymes. Homotropic effectors account for the sigmoidal nature of the velocity-
versus- substrate- concentration curve, whereas heterotropic effectors alter the midpoint of KM of the curve. Ultimately, both types of effectors work by altering the T/R ratio. The reconstitution shows that the complex quaternary structure and the resulting catalytic and regulatory properties are ultimately encoded in the primary structure of individual components.
The sequential model more readily accounts for negative cooperativity than does the concerted model.
KM is a measure of affinity only if k2 is rate limiting, which is the case here. Therefore, the lower KM means higher affinity. The mutant enzyme has a higher affinity.
50 µmol minute−1. 10 mM is KM, and KM yields 1/2Vmax. Vmax is 100 µmol minute−1, and so …
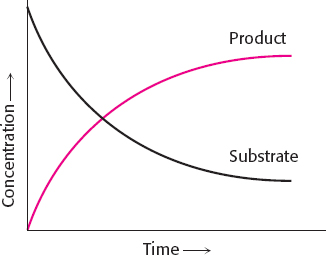
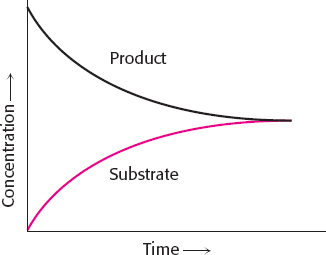
Enzymes do not alter the equilibrium of the reaction.
Enzyme 2. Despite the fact that enzyme 1 has a higher Vmax than enzyme 2, enzyme 2 shows greater activity at the concentration of the substrate in the environment because enzyme 2 has a lower KM for the substrate.
If the total amount of enzyme [E]T is increased, Vmax will increase, because Vmax = k2[ET]. But KM = (k−1 + k2)/k1; that is, it is independent of substrate concentration. The middle graph describes this situation.
The first step will be the rate-
limiting step. Enzymes EB and EC are operating at 1/2Vmax, whereas the KM for enzyme EA is greater than the substrate concentration. EA would be operating at approximately 10−2 Vmax. The most effective means of measuring the efficiency of any enzyme–
substrate complex is to determine the kcat/KM values. For the three substrates in question, the respective values of kcat/KM are 6, 15, and 36. Thus, the enzyme exhibits a strong preference for cleaving peptide bonds in which the second amino acid is a large hydrophobic amino acid and will cleave such peptides most rapidly. Page C8The kcat/KM for this substrate is 2. Not very effective. This value suggests that the enzyme prefers to cleave peptide bonds with the following specificity:
small R group—
large hydrophobic R group
The rates of utilization of substrates A and B are given by
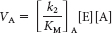
and
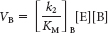
Hence, the ratio of these rates is
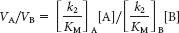
Thus, an enzyme discriminates between competing substrates on the basis of their values of k2/KM rather than that of KM alone.
The fluorescence spectroscopy reveals the existence of an enzyme–
serine complex and of an enzyme– serine– indole complex. 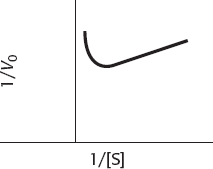
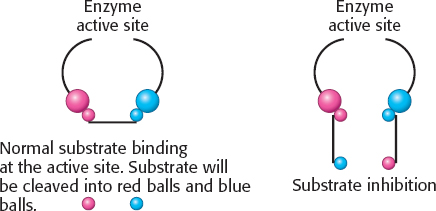
This behavior is substrate inhibition: at high concentrations, the substrate forms unproductive complexes at the active site. The adjoining drawing shows what might happen. Substrate normally binds in a defined orientation, shown in the drawing as red to red and blue to blue. At high concentrations, the substrate may bind at the active site such that the proper orientation is met for each end of the molecule, but two different substrate molecules are binding.
The binding of PALA switches ATCase from the T to the R state because PALA acts as a substrate analog. An enzyme molecule containing bound PALA has fewer free catalytic sites than does an unoccupied enzyme molecule. However, the PALA-
containing enzyme will be in the R state and hence have higher affinity for the substrates. The dependence of the degree of activation on the concentration of PALA is a complex function of the allosteric constant L0 and of the binding affinities of the R and T states for the analog and the substrates. The simple sequential model predicts that the fraction of catalytic chains in the R state, fR, is equal to the fraction containing bound substrate, Y. The concerted model, in contrast, predicts that fR increases more rapidly than Y as the substrate concentration is increased. The change in fR leads to the change in Y on addition of substrate, as predicted by the concerted model.
The binding of succinate to the functional catalytic sites of the native catalytic trimer changed the visible absorption spectrum of nitrotyrosine residues in the other, modified trimer of the hybrid enzyme. Thus, the binding of substrate analog to the active sites of one trimer altered the structure of the other trimer.
According to the concerted model, an allosteric activator shifts the conformational equilibrium of all subunits toward the R state, whereas an allosteric inhibitor shifts it toward the T state. Thus, ATP (an allosteric activator) shifted the equilibrium to the R form, resulting in an absorption change similar to that obtained when substrate is bound. CTP had a different effect. Hence, this allosteric inhibitor shifted the equilibrium to the T form. Thus, the concerted model accounts for the ATP-
induced and CTP- induced (heterotropic), as well as for the substrate- induced (homotropic), allosteric interactions of ATCase.