Appendix 5: Practicing Geology Exercises: Answers to Problems
Chapter 1 1.08 × 10¹² km3
Chapter 2 The distance between the North American and Charleston, South Carolina, continental margin and the African continental margin near Dakar, Senegal, measured using the Google Earth Ruler tool, is about 6300 km. From the isochron map in Figure 2.15, you can estimate that the two continents began to rift apart about 200 million to 180 million years ago (see also Figure 2.16). Assuming that the continents rifted apart 200 million years ago gives
6300 km × 200 million years = 31.5 km/year = 31.5 mm/year
Assuming that the rifting age is 180 million years gives
6300 km × 180 million years = 35 km/year = 35 mm/year
This corresponds to answer (d) of Chapter 2 Google Earth Exercise 3.
Chapter 3 $163,200,000 − $120,000,000 = $43,200,000 profit. So yes, it is worth it.
Chapter 4 Plagioclase feldspar will settle at a rate of 1.18 cm/hour, which is slower than olivine.
Chapter 5 125°C
Chapter 6 A change in pressure at constant temperature could indicate that the rocks were moved upward or downward in a subduction zone. Movements in subduction zones can be so fast that temperatures don’t have time to change even though pressures may be changing quickly.
Chapter 7 The chances of encountering oil in the reservoir rock at point C are poor. From the geologic structure exposed at the surface, you can see that the anticline is plunging to the northeast with a dip of about 30º. Therefore, the depth to the sandstone reservoir rock is increasing to the northeast, and drilling at point C is likely to encounter water, not oil.
Chapter 8 The rock age is given by
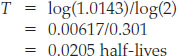
Multiplying this result by the half-life of rubidium-87 yields an age of
0.0205 × 49 billion years = 1.00 billion years
Chapter 9 The maximum variation in elevation at a landing site that could be tolerated by a lander with a fuel tank volume of 200 L is 750 m. The maximum acceptable variation if the final descent rate were 1 m/s instead of 2 m/s is 500 m.
Chapter 10 The fraction of relative plate movement taken up by thrust faulting is 20 mm/year ÷ 54 mm/year = 0.37. The remaining movement, about 60 percent of the total, is accommodated by faulting and folding north of the Himalaya, primarily by movement on the Altyn Tagh and other major strike-slip faults as China and Mongolia are pushed eastward (see Figure 10.16).
Chapter 11 Rock A: R = 5; Rock A does not record a distinctive signature of biological processes.
Rock C: R = −50; this large negative ratio, which is similar to that of the ratio for methane, does show a distinctive signature of biological processes.
Chapter 12 The production rate of the Hawaiian basalts is
100,000 km3 × 1 million years = 0.1 km3/year
The length of the Nazca-Pacific plate boundary needed to produce this amount is given by the following equation:
1.4 × 10⁻⁴ km/year × 7 km × length = 0.1 km3/year
or
length = 0.1 km3/year ÷ (1.4 × 10⁻⁴ km/year × 7 km) = 102 km
Chapter 13 A magnitude 6 rupture has 100 times the area of a magnitude 4 rupture (because 10(6−4) = 102) and 10 times the slip (because 10(6−4)/2 = 101); therefore, it takes 100 × 10 = 1000 magnitude 4 earthquakes to equal a magnitude 6 earthquake.
Chapter 14 The appropriate isostatic equation is
Tibetan Plateau elevation = 0.15 × Tibetan Plateau crustal thickness − 0.12 × 7.0 km − 0.70 × 4.5 km
Solving for crustal thickness, we obtain
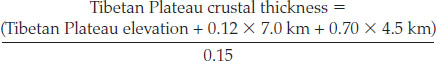
For an elevation of 5 km, this formula gives a crustal thickness of 60 km, which agrees with seismic data collected in the Tibetan Plateau.
AP-10
Chapter 15 Carbon balance requires that
emissions − (atmosphere-ocean flux) − (atmosphere-land surface flux) = atmospheric accumulation
For the 1990s, the numbers are
6.4 Gt/year − 2.2 Gt/year − 1.0 Gt/year = 3.2 Gt/year
For 2000–2005, the numbers are
7.2 Gt/year − 2.2 Gt/year − 0.9 Gt/year = 4.12 Gt/year
Comparing the two results we see that the rate at which carbon is accumulating in the atmosphere rose by 0.9 Gt/year, which is not good news!
Table C
| SAFETY FACTOR (FS) | |||
|---|---|---|---|
| Loose Soil | Slate | Granite | |
| 5° | 3 | 10 | 50 |
| 20° | 0.6 | 2 | 10 |
| 30° | 0.12 | 0.4 | 2 |
A safety factor value greater than one indicates that a slope is stable enough to build on.
Chapter 17 Silty sand: 0.0015 m3/day
Well-sorted gravel: 18.75 m3/day
Chapter 18 10 feet = about 6000 cubic feet per second
25 feet = about 40,000 cubic feet per second
Chapter 19 Each box is 100 km2.
Minimum area susceptible to desertification:
391 × 100 km2 = 31,000 km2
Maximum area susceptible to desertification:
513 × 100 km2 = 51,300 km2
Chapter 20 The 2002 maintenance fill cost about $25 million.
Chapter 21 200 mm ÷ 0.0001 = 2 × 106 mm = 2 km
Chapter 22 Elevation = 250 m; age = 50,000 years
250 m/50,000 years = 0.005 m/year