Practicing Geology Exercise
How Fast Are the Himalaya Rising, and How Quickly Are They Eroding?
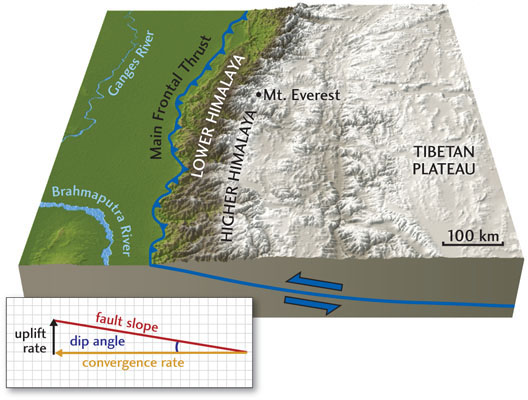
The Himalaya, the world’s highest and most rugged mountains, are being raised by thrust faulting caused by the collision of India with Asia (see Figure 10.15). How rapidly are they rising, and how quickly are they being eroded away? The answers to these questions depend on accurate topographic mapping.
On February 6, 1800, Colonel William Lambton, of the 33rd Regiment of Foot of the British Army, received orders to begin the Great Trigonometrical Survey of India, the most ambitious scientific project of the nineteenth century. Over the next several decades, intrepid British explorers led by Lambton and his successor, George Everest, hauled bulky telescopes and heavy surveying equipment through the jungles of the Indian subcontinent, triangulating the positions of reference monuments established at high points in the terrain, from which they could accurately establish Earth’s size and shape. Along the way, in 1852, the surveyors discovered that an obscure Himalayan peak, known on their maps only as “Peak XV,” was the highest mountain on Earth. They promptly named it Mount Everest, in honor of their former boss. Its official Tibetan name, Chomolungma, means “Mother of the Universe.”
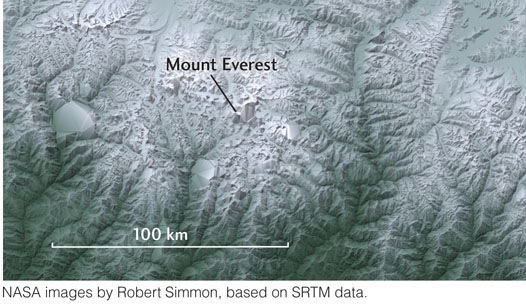
On February 11, 2000, almost exactly 200 years after Lambton commenced his exploration, NASA launched another great survey, the Shuttle Radar Topography Mission (SRTM). The space shuttle Endeavour carried two large radar antennas into low Earth orbit, one in the cargo bay and the second mounted on a mast that could extend up to 60 m outward. Working together like a pair of eyes, these antennas mapped the height of the land surface below the shuttle on a grid of very dense geographic points, rendering the terrain in unprecedented three-dimensional detail. Remarkably, the height of Mount Everest as confirmed by the SRTM (8850 m, or 29,035 feet) turned out to be only 10 m more than the original 1852 estimate.
280
Although the accuracy of the Great Trigonometrical Survey was impressive, data collection was a slow process. It took the British over 70 years to measure the positions of 2700 stations across the Indian subcontinent, an average of about one position every 3 months. In comparison, the SRTM collected about 3000 position measurements each second. In just 11 days, the SRTM mapped 2.6 billion points covering 80 percent of Earth’s land surface, including many remote areas of the continents that had not been previously surveyed. And, unlike the British surveyors, the shuttle crew did not have to contend with malaria or tigers!
The SRTM position measurements have been used to create a digital elevation model, or DEM, of the Himalaya, shown here as a topographic map. An analysis of the features on this map, which includes Earth’s highest peaks and deepest gorges, indicates that the average height of the mountain range is staying approximately constant in time. In other words, the rate at which the Himalaya are rising is almost exactly balanced by the rate at which they are eroding:
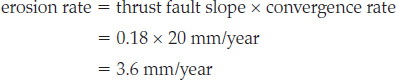
uplift rate = erosion rate
As shown in the cross section, the geometry of the main thrust fault implies that
thrust fault slope = uplift rate ÷ convergence rate
Using GPS data, geologists have measured the convergence rate across the Himalaya to be about 20 mm/year. From earthquake locations, we know that the main thrust fault dips at an angle of about 10° below the mountain range. The slope of the fault is the tangent of its dip angle. Using a scientific calculator, we find tangent(10°) = 0.18. Therefore, the erosion rate is
This estimate is consistent with the erosion rate of 3–4 mm/year obtained from the pressure-temperature paths of metamorphic rocks in the Himalaya exhumed by erosion, using the techniques described in Chapter 6.
BONUS PROBLEM: Given that the convergence rate between the Indian and Eurasian plates is about 54 mm/year (see Figure 2.7), what fraction of the relative plate movement is taken up by thrust faulting in the Himalaya? How is the remaining plate movement accommodated by deformation in Eurasia?