Earthquake Hazards and Risks
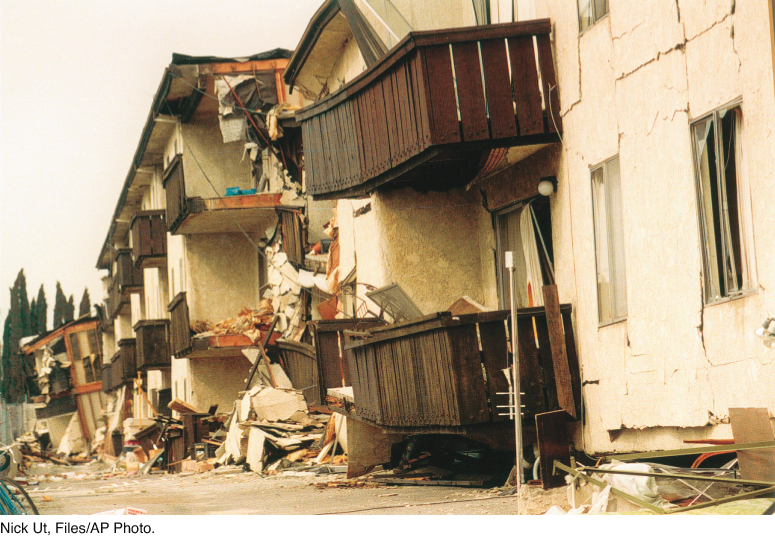
In just the last decade, earthquakes worldwide have killed more than 700,000 people and disrupted the economies of entire regions. The United States has been relatively lucky, although two earthquakes on the San Andreas fault—the 1989 Loma Prieta earthquake (magnitude 7.1), which occurred 80 km south of San Francisco, and the 1994 Northridge earthquake in Los Angeles—were among the costliest disasters in the nation’s history. Damage amounted to more than $10 billion in the Loma Prieta quake and $40 billion in the Northridge quake because of their proximity to urban centers. About 60 people died in each event, but the death toll would have been many times higher if stringent building codes had not been in place (Figure 13.19).
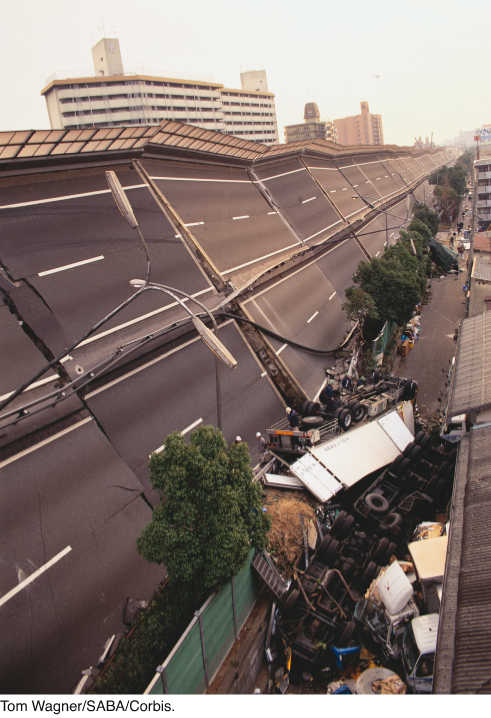
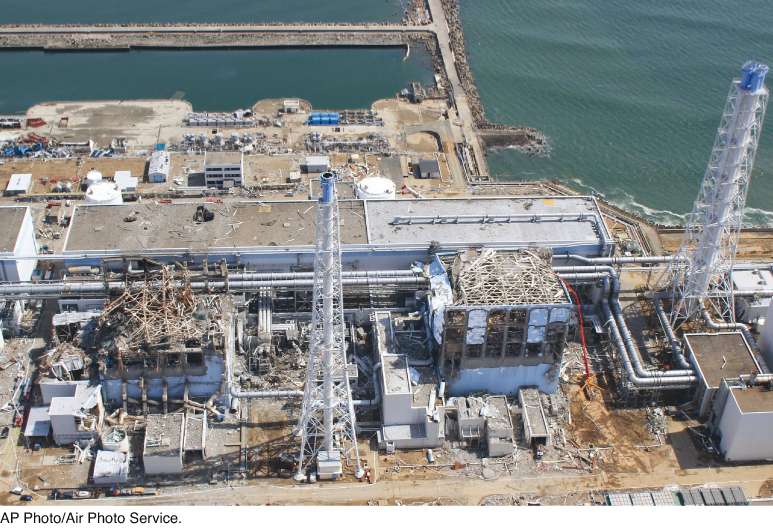
Destructive earthquakes are even more frequent in Japan than in California. The recorded history of destructive earthquakes in Japan, going back 2000 years, has left an indelible impression on the Japanese people. Perhaps that is why Japan is the best prepared of any nation in the world to deal with earthquakes. It has impressive public education campaigns, building codes, and warning systems. Despite this preparedness, more than 5600 people were killed in a devastating (magnitude 6.9) earthquake that struck the city of Kobe on January 16, 1995 (Figure 13.20). The large numbers of casualties and structural failures (50,000 buildings destroyed) resulted partly from the less stringent building codes that were in effect before 1980, when much of the city was built, and partly from the location of the earthquake rupture, which was very close to the city. The tsunami of the 2011 Tohoku earthquake caused an even greater loss of life (almost 20,000). The disaster was compounded by meltdowns and explosions at the Fukushima-Daiichi power plant, one of the world’s largest nuclear facilities (see Figure 13.30). Although the economic costs are still being counted, the Tohoku earthquake is already the most expensive natural disaster in recorded history.
366
How Earthquakes Cause Damage
Earthquakes proceed as chain reactions in which the primary effects of earthquakes—faulting and ground shaking—trigger secondary effects, which include landslides and tsunamis as well as destructive processes within the built environment, such as collapsing structures and fires.
Faulting and Shaking
The primary hazards of earthquakes are the ruptures in the ground surface that occur when faults break the surface, the permanent subsidence and uplift of the ground surface caused by faulting, and the ground shaking caused by seismic waves radiated during the quake. Seismic waves can shake structures so hard that they collapse. The ground accelerations near the epicenter of a large earthquake can approach and even exceed the acceleration of gravity, so an object lying on the ground surface can literally be thrown into the air. Very few structures built by human hands can survive such severe shaking, and those that do are severely damaged.
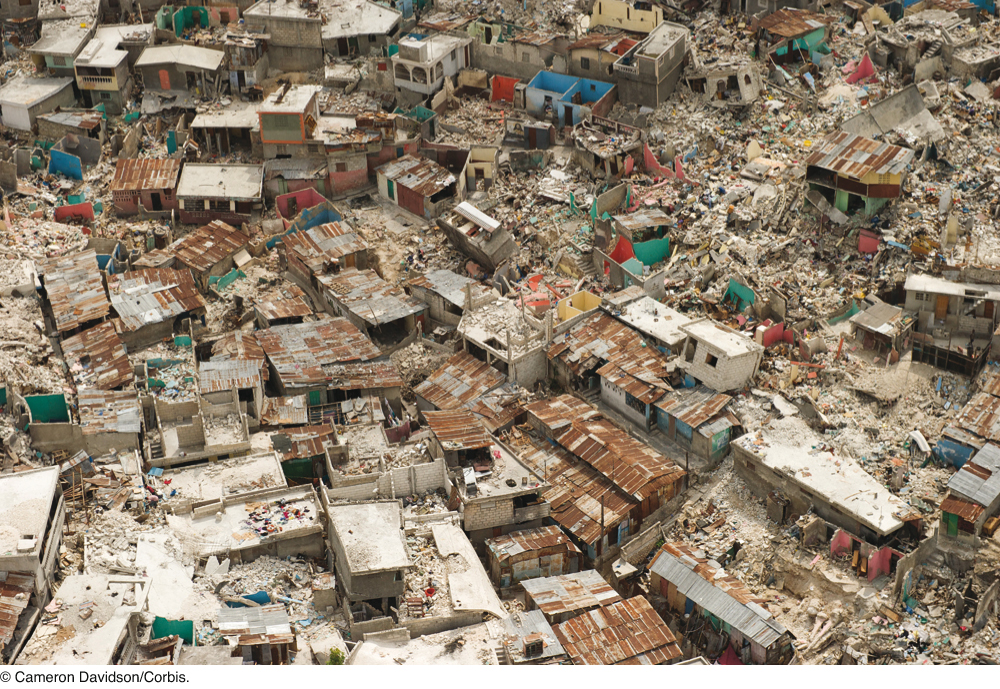
The collapse of buildings and other structures is the leading cause of casualties and economic damage during earthquakes. In cities, most casualties are caused by falling buildings and their contents. Death tolls can be especially high in densely populated areas of developing countries, where buildings are often constructed from bricks and mortar without steel reinforcement. A magnitude 7 earthquake on January 12, 2010, destroyed 250,000 residences and 30,000 commercial buildings in Haiti’s capital city, Port-au-Prince, killing more than 230,000 people, making it the fifth deadliest seismic disaster ever recorded (Figure 13.21). Improving construction practices so that buildings are able to withstand shaking is the key to avoiding such tragedies.
367
Landslides and Other Types of Ground Failure
The primary hazards of faulting and ground shaking generate a number of secondary hazards. Among secondary hazards are landslides and other forms of ground failure that give rise to mass movements of Earth materials (described in Chapter 16). When seismic waves shake water-saturated soils, those soils can behave like a liquid and become unstable. The ground simply flows away, taking buildings, bridges, and everything else with it. Such soil liquefaction destroyed the residential area of Turnagain Heights near Anchorage, Alaska, in the 1964 earthquake (see Figure 16.16); the Nimitz Freeway near San Francisco in the 1989 Loma Prieta earthquake; and areas of Kobe in the 1995 earthquake. Liquefaction was responsible for much of the damage during the 2010–2011 earthquake sequence in Christchurch, New Zealand, destroying many homes and causing massive damage to underground water and sewer systems throughout the city.
In some instances, ground failure can cause more damage than the ground shaking itself. A 1970 earthquake in Peru triggered an immense avalanche of rock and snow (up to 50 million cubic meters) that destroyed the mountain towns of Yungay and Ranrahirca (see Figure 16.25). Of the more than 66,000 people killed in the earthquake, about 18,000 of them died in the avalanche.
Tsunamis
A large earthquake that occurs beneath the ocean can generate a destructive sea wave, sometimes called a “tidal wave,” but more accurately named a tsunami (Japanese for “harbor wave”), since it has nothing to do with tides. Tsunamis are by far the deadliest and most destructive hazards associated with the world’s largest earthquakes: the megathrust events that occur in subduction zones.
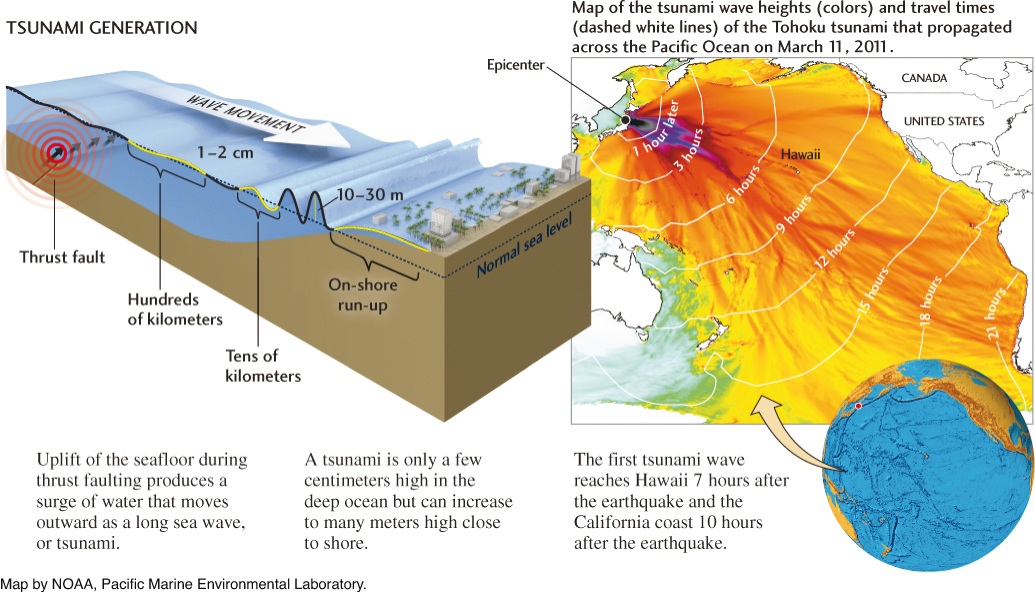
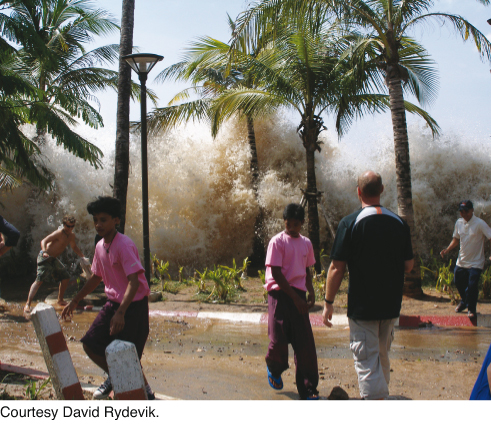
When a megathrust ruptures, it can push the seafloor landward of the deep-sea trench upward by as much as 10 m, displacing a large mass of the overlying ocean water. This disturbance flows outward in waves that travel across the ocean at speeds of up to 800 km/hour (about as fast as a commercial jetliner). In the deep sea, a tsunami is hardly noticeable, but when it approaches shallow coastal waters, the waves slow down and pile up, inundating the shoreline in walls of water that can reach heights of tens of meters (Figure 13.22). This “run-up” can propagate inland for hundreds of meters or even kilometers, depending on the slope of the land surface.
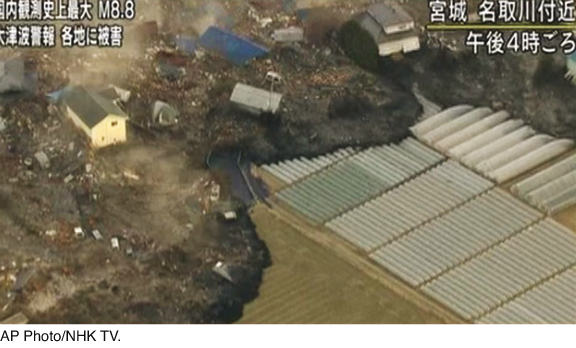
Tsunamis caused by megathrust events are most common in the Pacific Ocean, which is ringed with very active subduction zones. The destructive power of a great tsunami was brought home by the terrifying video images captured on March 11, 2011 as the Tohoku tsunami swept over the shoreline of northeastern Japan. In the coastal city of Miyako, the height of the water mass reached an astounding 38 m (123 ft!) above normal sea level, destroying nearly everything in its path (see Earth Issues 13.1). In low-lying regions near the port city of Sendai, the tsunami traveled up to 10 km inland, transporting huge floating debris fields of buildings, boats, cars, and trucks (Figure 13.23). The waves propagated across the entire Pacific Ocean, attaining heights of more than 2 m along the coast of Chile, 16,000 km away.
368
Tsunami warning systems in Japan and the circum--Pacific region worked according to design. The warning times along the Japanese coast nearest the earthquake were too short for complete evacuation. Nevertheless, the system is credited with saving many thousands of lives.
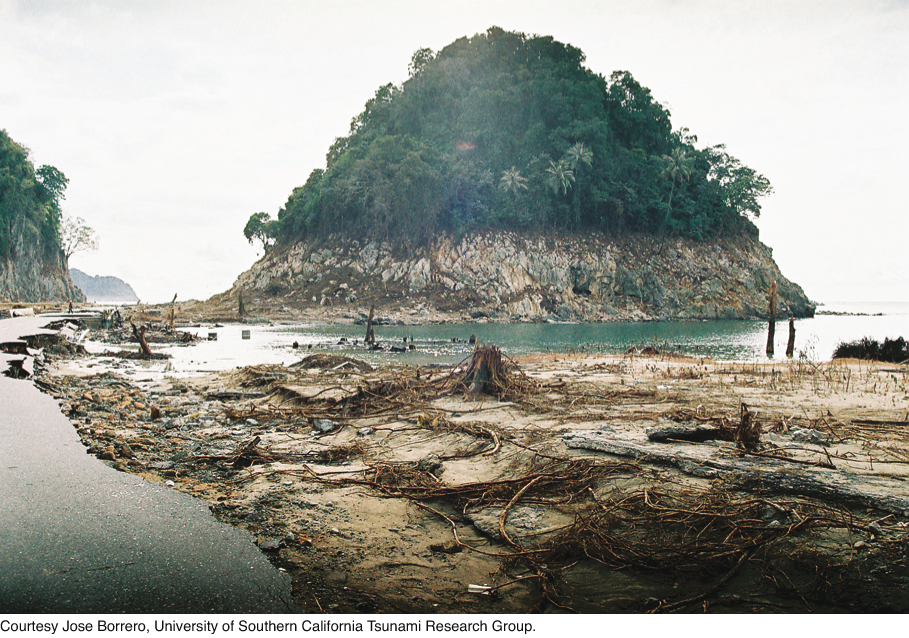
No tsunami warning system was in place when the magnitude 9.2 Sumatra earthquake of September 26, 2004 unleashed an ocean-wide tsunami that swept over low--lying coastal areas from Indonesia and Thailand to Sri Lanka, India, and the east coast of Africa (Figure 13.24). Within 15 minutes, the first wave ran up the Sumatran coastline. Few eyewitnesses survived there, but geologic investigations after the tsunami indicated that the maximum wave height on the beaches of the west-facing coast was about 15m, and the run-up attained heights of 25 to 35 m, reaching inland up to 2 km and wiping out most building structures, vegetation, and life in its path (Figure 13.25). It is believed that more than 150,000 people perished along the Sumatran coastline, though no one will ever be sure because many bodies were washed out to sea.
369
Disturbances of the seafloor caused by landslides or volcanic eruptions can also produce tsunamis. The 1883 explosion of Krakatau, a volcano in Indonesia, generated a tsunami that reached 40 m in height and drowned 36,000 people on nearby coasts.
Fires
The secondary hazards of earthquakes also include destructive processes that stem from the nature of the built environment itself, such as the fires ignited by ruptured gas lines or downed electric power lines. Damage to water mains in an earthquake can make firefighting all but impossible—a circumstance that contributed to the burning of San Francisco after the 1906 earthquake (see Figure 13.1). Most of the 140,000 fatalities in the 1923 Kanto earthquake, one of Japan’s greatest disasters, resulted from fires in the cities of Tokyo and Yokohama.
Reducing Earthquake Risk
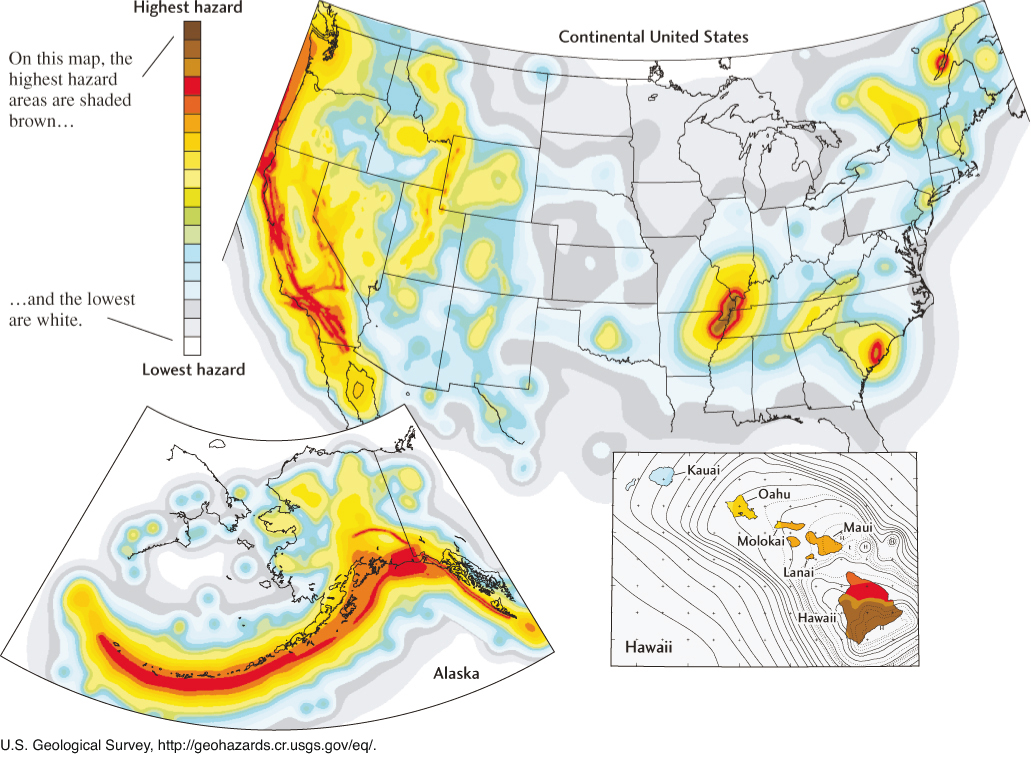
In assessing the possibility of damage from earthquakes, or from any type of natural disaster, it is important to distinguish between hazard and risk. In the case of earthquakes, seismic hazard describes the frequency and intensity of earthquake shaking and ground disruption that can be expected over the long term at some specified location. Seismic hazard, which depends on the proximity of the site to active faults that might generate earthquakes, can be expressed in the form of a seismic hazard map. Figure 13.26 displays the national seismic hazard map produced by the U.S. Geological Survey.
370
In contrast, seismic risk describes the damage that can be expected over the long term in a specified region, such as a county or state, usually measured in terms of casualties and dollar losses per year. A region’s risk depends not only on its seismic hazard, but also on its exposure to seismic damage (its population and density of buildings and other infrastructure) and its fragility (the vulnerability of its built environment to seismic shaking). Because so many geologic and economic variables must be considered, estimating seismic risk is a complex job. The results of the first comprehensive study of seismic risk in the United States, published by the Federal Emergency Management Agency in 2001, are presented in Figure 13.27.
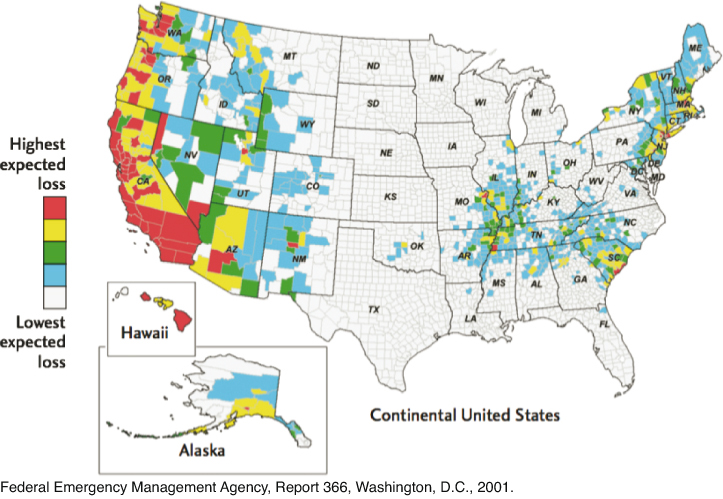
The differences between seismic hazard and seismic risk can be appreciated by comparing the two types of national maps. For instance, although the seismic hazard levels in Alaska and California are both high, California’s exposure to seismic damage is much greater, yielding a much larger total risk. California leads the nation in seismic risk, with about 75 percent of the national total; in fact, a single county, Los Angeles, accounts for 25 percent. Nonetheless, the problem is truly national: 46 million people in several metropolitan areas outside of California face substantial earthquake risks. Those areas include Hilo, Honolulu, Anchorage, Seattle, Tacoma, Portland, Salt Lake City, Reno, Las Vegas, Albuquerque, Charleston, Memphis, Atlanta, St. Louis, New York, Boston, and Philadelphia.
Not much can be done about seismic hazard because we have no way to prevent or control earthquakes. However, there are many important steps that society can take to reduce seismic risk if the hazard is properly characterized.
371
Hazard Characterization
The first step is to follow the advice of the old proverb, “Know thy enemy.” We still have much to learn about the sizes and frequencies of ruptures on active faults. For example, it is only in the past couple of decades that we have come to appreciate that an earthquake in the Cascadia subduction zone, which stretches from northern California through Oregon and Washington to British Columbia, could produce a tsunami as large as the one that devastated the Indian Ocean region in 2004 and Japan in 2011. These dangers became apparent when geologists found evidence of a magnitude 9 earthquake that occurred in 1700, before any written historical accounts of the area existed. This monstrous rupture caused major ground subsidence along the Cascadia coastline and left a record of flooded, dead coastal forests. A tsunami at least 5 m high hit Japan, where historical records pin down its exact date (January 26, 1700). Geologists know that the Juan de Fuca Plate is being subducted under the North American Plate at a rate of about 40 mm/year. They have debated whether this movement occurs seismically, by continuous creep, or perhaps by silent earthquakes, but current opinion pegs the average time between magnitude 9 earthquakes in the Cascadia subduction zone at 500 to 600 years.
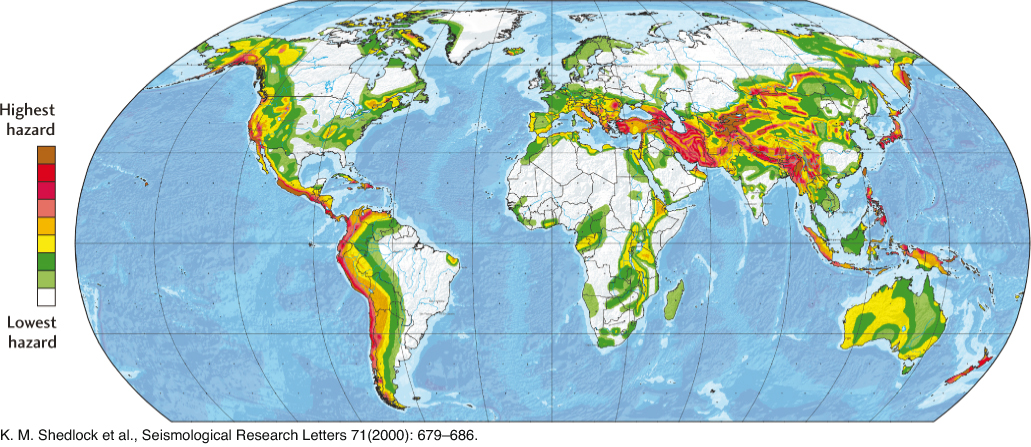
Although we have a good understanding of seismic hazard in some parts of the world—the United States and Japan in particular—we know much less about other regions. During the 1990s, the United Nations sponsored an effort to map seismic hazard worldwide as part of the International Decade of Natural Disaster Reduction. This effort resulted in the first global seismic hazard map, shown in Figure 13.28. The map is based primarily on historical earthquakes, so it may underestimate the hazard in some regions where the historical record is short. Much more needs to be done to characterize seismic hazard on a global scale.
372
Land-Use Policies
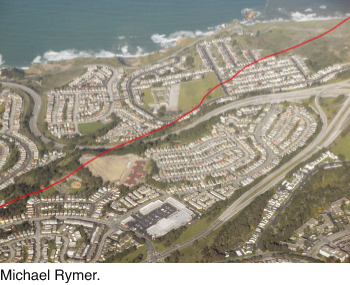
The exposure of buildings and other structures to seismic hazard can be reduced by policies that restrict land uses in high-hazard areas. This approach works well where the hazard is localized, as in the case of known faults. Erecting buildings on active faults, as was done in the case of the residential developments pictured in Figure 13.29, is clearly unwise, because few buildings can withstand the deformation to which they might be subjected during a quake. In the 1971 San Fernando earthquake, a fault ruptured under a densely populated area of Los Angeles, destroying almost 100 structures. The state of California responded in 1972 with a law that restricts the construction of new buildings across an active fault. If an existing residence is on or very near a fault, the owners and real estate agents are required to disclose that information to potential buyers. A notable omission is that the act does not cover publicly owned or industrial facilities.
Siting of nuclear power plants and other critical industrial facilities to avoid seismic and tsunamic hazards would seem to be an obvious priority, but the experience in Japan shows how additional considerations, such as the need for water to cool the reactors, can lead to unwise compromises. Two nuclear facilities along the Japanese coast have been severely damaged by the earthquakes in the last few years, the Kashiwazaki-Kariwa facility in 2007 and the Fukushima-Daiichi facility in 2011 (Figure 13.30). The heightened public concern about the earthquake safety of nuclear power plants has led the Japanese government to shut down a number of nuclear plants, raising concerns about future power shortages.
Earthquake Engineering
Although land-use policies help to reduce the risk from localized hazards such as ground ruptures and soil liquefaction, they are less effective where seismic shaking is distributed across large regions. The risks from seismic shaking can best be reduced by good engineering and construction. Standards for the design and construction of new buildings are regulated by building codes enacted by state and local governments. A building code specifies the forces a structure must be able to withstand, based on the maximum intensity of shaking expected in the area. In the aftermath of an earthquake, engineers study buildings that were damaged and recommend modifications to building codes that could reduce future damage from similar earthquakes.
373
U.S. building codes have been largely successful in preventing loss of life during earthquakes. In the 20-year period from 1981 to 2012 for example, 146 people died in 11 severe earthquakes in the western United States, whereas more than 1 million people were killed by earthquakes worldwide. Nevertheless, more can be done. Damage from inevitable earthquakes could be reduce by retrofitting older, more vulnerable structures to be seismically safe, as well as by using specialized construction materials and advanced engineering methods in new construction, such as putting entire buildings on movable supports to isolate them from seismic shaking.
Emergency Preparedness and Response
Public authorities must plan ahead and be prepared with emergency supplies, rescue teams, evacuation procedures, firefighting plans, and other steps to minimize the consequences of a severe earthquake. For individuals, earthquake preparedness begins at home. Earth Issues 13.2 summarizes some of the steps you can take to protect yourself and your family from earthquakes.
Once an earthquake happens, networks of seismographs can transmit signals automatically to central processing facilities. In a fraction of a minute, computers can pinpoint the earthquake’s focus, measure its magnitude, and determine its fault mechanism. If equipped with strong-motion sensors that accurately record the most violent shaking, these automated systems can also deliver accurate maps in nearly real time showing where the ground shaking was strong enough to cause significant damage. Such “ShakeMaps” can help emergency managers and other officials deploy equipment and personnel as quickly as possible to save people trapped in rubble and to reduce further economic losses from fires and other secondary hazards. Bulletins about the magnitude and area of the shaking can also be channeled through the mass media to reduce public confusion during disasters or to allay the fears aroused by minor tremors.